Index of Topics
- - A -
- Analyze Routines
_arc, _arc_w, _arc_wxy
Attribute Routines
- C -
- Classes of Graphics Routines
_clearscreen
Coordinate System Routines
- D -
- Display Routines
_displaycursor
Drawing Routines
- E -
- _ellipse, _ellipse_w, _ellipse_wxy
Environment Routines
- F -
- _floodfill, _floodfill_w
Font Manipulation Routines
- G -
- _getactivepage
_getarcinfo
_getbkcolor
_getcliprgn
_getcolor
_getcurrentposition, _getcurrentposition_w
_getfillmask
_getfontinfo
_getgtextextent
_getgtextvector
_getimage, _getimage_w, _getimage_wxy
_getlinestyle
_getphyscoord
_getpixel, _getpixel_w
_getplotaction
_gettextcolor
_gettextcursor
_gettextextent
_gettextposition
_gettextsettings
_gettextwindow
_getvideoconfig
_getviewcoord, _getviewcoord_w, _getviewcoord_wxy
_getvisualpage
_getwindowcoord
Graphics Adapters
Graphics Library
Graphics Library Routines
Graphics Routines
Graphics Text Routines
_grstatus
_grtext, _grtext_w
- I -
- Image Manipulation Routines
_imagesize, _imagesize_w, _imagesize_wxy
Include Files
- L -
- _lineto, _lineto_w
- M -
- _moveto, _moveto_w
- O -
- _outgtext
_outmem
_outtext
- P -
- _pg_analyzechart, _pg_analyzechartms
_pg_analyzepie
_pg_analyzescatter, _pg_analyzescatterms
_pg_chart, _pg_chartms
_pg_chartpie
_pg_chartscatter, _pg_chartscatterms
_pg_defaultchart
_pg_getchardef
_pg_getpalette
_pg_getstyleset
_pg_hlabelchart
_pg_initchart
_pg_resetpalette
_pg_resetstyleset
_pg_setchardef
_pg_setpalette
_pg_setstyleset
_pg_vlabelchart
_pie, _pie_w, _pie_wxy
_polygon, _polygon_w, _polygon_wxy
Presentation Graphics Routines
_putimage, _putimage_w
- R -
- _rectangle, _rectangle_w, _rectangle_wxy
_registerfonts
_remapallpalette
_remappalette
- S -
- _scrolltextwindow
_selectpalette
_setactivepage
_setbkcolor
_setcharsize, _setcharsize_w
_setcharspacing, _setcharspacing_w
_setcliprgn
_setcolor
_setfillmask
_setfont
_setgtextvector
_setlinestyle
_setpixel, _setpixel_w
_setplotaction
_settextalign
_settextcolor
_settextcursor
_settextorient
_settextpath
_settextposition
_settextrows
_settextwindow
_setvideomode
_setvideomoderows
_setvieworg
_setviewport
_setvisualpage
_setwindow
- T -
- Text Routines
- U -
- _unregisterfonts
Utility Routines
- W -
- _wrapon
Graphics Library
The Open Watcom FORTRAN 77 Graphics Library consists of a large number of routines that provide graphical image support
under DOS and QNX. This chapter provides an overview of this support. The following topics are discussed.
- Graphics Routines
- Graphics Adapters
- Classes of Graphics Routines
- Environment Routines
- Coordinate System Routines
- Attribute Routines
- Drawing Routines
- Text Routines
- Graphics Text Routines
- Image Manipulation Routines
- Font Manipulation Routines
- Presentation Graphics Routines
Display Routines
Analyze Routines
Utility Routines
- Include Files
Graphics Routines
Graphics routines are used to display graphical images such as lines and circles upon the computer screen. Routines
are also provided for displaying text along with the graphics output.
Graphics Adapters
Support is provided for both color and monochrome screens which are connected to the computer using any of the following
graphics adapters:
- IBM Monochrome Display/Printer Adapter (MDPA)
- IBM Color Graphics Adapter (CGA)
- IBM Enhanced Graphics Adapter (EGA)
- IBM Multi-Color Graphics Array (MCGA)
- IBM Video Graphics Array (VGA)
- Hercules Monochrome Adapter
- SuperVGA adapters (SVGA) supplied by various manufacturers
Classes of Graphics Routines
The routines in the Open Watcom FORTRAN 77 Graphics Library can be organized into a number of classes:
- Environment Routines
-
These routines deal with the hardware environment.
Coordinate System Routines
-
These routines deal with coordinate systems and mapping coordinates from one system to another.
Attribute Routines
-
These routines control the display of graphical images.
Drawing Routines
-
These routines display graphical images such as lines and ellipses.
Text Routines
-
These routines deal with displaying text in both graphics and text modes.
Graphics Text Routines
-
These routines deal with displaying graphics text.
Image Manipulation Routines
-
These routines store and retrieve screen images.
Font Manipulation Routines
-
These routines deal with displaying font based text.
Presentation Graphics Routines
-
These routines deal with displaying presentation graphics elements such as bar charts and pie charts.
The following subsections describe these routine classes in more detail. Each routine in the class is noted with
a brief description of its purpose.
Environment Routines
These routines deal with the hardware environment. The _getvideoconfig routine returns
information about the current video mode and the hardware configuration. The _setvideomode
routine selects a new video mode.
Some video modes support multiple pages of screen memory. The visual page (the one displayed on the screen)
may be different than the active page (the one to which objects are being written).
The following routines are defined:
- _getactivepage
- get the number of the current active graphics page
_getvideoconfig
- get information about the graphics configuration
_getvisualpage
- get the number of the current visual graphics page
_grstatus
- get the status of the most recently called graphics library routine
_setactivepage
- set the active graphics page (the page to which graphics objects are drawn)
_settextrows
- set the number of rows of text displayed on the screen
_setvideomode
- select the video mode to be used
_setvideomoderows
- select the video mode and the number of text rows to be used
_setvisualpage
- set the visual graphics page (the page displayed on the screen)
Coordinate System Routines
These routines deal with coordinate systems and mapping coordinates from one system to another. The Open Watcom
FORTRAN 77 Graphics Library supports three coordinate systems:
- Physical coordinates
- View coordinates
- Window coordinates
Physical coordinates match the physical dimensions of the screen. The physical origin, denoted (0,0), is located
at the top left corner of the screen. A pixel to the right of the origin has a positive x-coordinate and a pixel below
the origin will have a positive y-coordinate. The x- and y-coordinates will never be negative values.
The view coordinate system can be defined upon the physical coordinate system by moving the origin from the top left
corner of the screen to any physical coordinate (see the _setvieworg routine). In the view
coordinate system, negative x- and y-coordinates are allowed. The scale of the view and physical coordinate systems
is identical (both are in terms of pixels)
The window coordinate system is defined in terms of a range of user-specified values (see the _setwindow
routine). These values are scaled to map onto the physical coordinates of the screen. This allows for consistent
pictures regardless of the resolution (number of pixels) of the screen.
The following routines are defined:
- _getcliprgn
- get the boundary of the current clipping region
_getphyscoord
- get the physical coordinates of a point in view coordinates
_getviewcoord
- get the view coordinates of a point in physical coordinates
_getviewcoord_w
- get the view coordinates of a point in window coordinates
_getviewcoord_wxy
- get the view coordinates of a point in window coordinates
_getwindowcoord
- get the window coordinates of a point in view coordinates
_setcliprgn
- set the boundary of the clipping region
_setvieworg
- set the position to be used as the origin of the view coordinate system
_setviewport
- set the boundary of the clipping region and the origin of the view coordinate system
_setwindow
- define the boundary of the window coordinate system
Attribute Routines
These routines control the display of graphical images such as lines and circles. Lines and figures are drawn using
the current color (see the _setcolor routine), the current line style (see the _setlinestyle
routine), the current fill mask (see the _setfillmask routine), and the current plotting action
(see the _setplotaction routine).
The following routines are defined:
- _getarcinfo
- get the endpoints of the most recently drawn arc
_getbkcolor
- get the background color
_getcolor
- get the current color
_getfillmask
- get the current fill mask
_getlinestyle
- get the current line style
_getplotaction
- get the current plotting action
_remapallpalette
- assign colors for all pixel values
_remappalette
- assign color for one pixel value
_selectpalette
- select a palette
_setbkcolor
- set the background color
_setcolor
- set the current color
_setfillmask
- set the current fill mask
_setlinestyle
- set the current line style
_setplotaction
- set the current plotting action
Drawing Routines
These routines display graphical images such as lines and ellipses. Routines exist to draw straight lines (see the
_lineto routine), rectangles (see the _rectangle routine), polygons (see
the _polygon routine), ellipses (see the _ellipse routine), elliptical arcs
(see the _arc routine) and pie-shaped wedges from ellipses (see the _pie routine).
These figures are drawn using the attributes described in the previous section. The routines ending with
_w or _wxy use the window coordinate system; the others use the view coordinate system.
The following routines are defined:
- _arc
- draw an arc
_arc_w
- draw an arc using window coordinates
_arc_wxy
- draw an arc using window coordinates
_clearscreen
- clear the screen and fill with the background color
_ellipse
- draw an ellipse
_ellipse_w
- draw an ellipse using window coordinates
_ellipse_wxy
- draw an ellipse using window coordinates
_floodfill
- fill an area of the screen with the current color
_floodfill_w
- fill an area of the screen in window coordinates with the current color
_getcurrentposition
- get the coordinates of the current output position
_getcurrentposition_w
- get the window coordinates of the current output position
_getpixel
- get the color of the pixel at the specified position
_getpixel_w
- get the color of the pixel at the specified position in window coordinates
_lineto
- draw a line from the current position to a specified position
_lineto_w
- draw a line from the current position to a specified position in window coordinates
_moveto
- set the current output position
_moveto_w
- set the current output position using window coordinates
_pie
- draw a wedge of a "pie"
_pie_w
- draw a wedge of a "pie" using window coordinates
_pie_wxy
- draw a wedge of a "pie" using window coordinates
_polygon
- draw a polygon
_polygon_w
- draw a polygon using window coordinates
_polygon_wxy
- draw a polygon using window coordinates
_rectangle
- draw a rectangle
_rectangle_w
- draw a rectangle using window coordinates
_rectangle_wxy
- draw a rectangle using window coordinates
_setpixel
- set the color of the pixel at the specified position
_setpixel_w
- set the color of the pixel at the specified position in window coordinates
Text Routines
These routines deal with displaying text in both graphics and text modes. This type of text output can be displayed
in only one size.
This text is displayed using the _outtext and _outmem routines.
The output position for text follows the last text that was displayed or can be reset (see the _settextposition
routine). Text windows can be created (see the _settextwindow routine) in which the text
will scroll. Text is displayed with the current text color (see the _settextcolor routine).
The following routines are defined:
- _clearscreen
- clear the screen and fill with the background color
_displaycursor
- determine whether the cursor is to be displayed after a graphics routine completes execution
_getbkcolor
- get the background color
_gettextcolor
- get the color used to display text
_gettextcursor
- get the shape of the text cursor
_gettextposition
- get the current output position for text
_gettextwindow
- get the boundary of the current text window
_outmem
- display a text string of a specified length
_outtext
- display a text string
_scrolltextwindow
- scroll the contents of the text window
_setbkcolor
- set the background color
_settextcolor
- set the color used to display text
_settextcursor
- set the shape of the text cursor
_settextposition
- set the output position for text
_settextwindow
- set the boundary of the region used to display text
_wrapon
- permit or disallow wrap-around of text in a text window
Graphics Text Routines
These routines deal with displaying graphics text. Graphics text is displayed as a sequence of line segments, and
can be drawn in different sizes (see the _setcharsize routine), with different orientations (see
the _settextorient routine) and alignments (see the _settextalign
routine). The routines ending with _w use the window coordinate system; the others use the view coordinate
system.
The following routines are defined:
- _gettextextent
- get the bounding rectangle for a graphics text string
_gettextsettings
- get information about the current settings used to display graphics text
_grtext
- display graphics text
_grtext_w
- display graphics text using window coordinates
_setcharsize
- set the character size used to display graphics text
_setcharsize_w
- set the character size in window coordinates used to display graphics text
_setcharspacing
- set the character spacing used to display graphics text
_setcharspacing_w
- set the character spacing in window coordinates used to display graphics text
_settextalign
- set the alignment used to display graphics text
_settextorient
- set the orientation used to display graphics text
_settextpath
- set the path used to display graphics text
Image Manipulation Routines
These routines are used to transfer screen images. The _getimage routine transfers a rectangular
image from the screen into memory. The _putimage routine transfers an image from memory back
onto the screen. The routines ending with _w or _wxy use the window coordinate system; the others
use the view coordinate system.
The following routines are defined:
- _getimage
- store an image of an area of the screen into memory
_getimage_w
- store an image of an area of the screen in window coordinates into memory
_getimage_wxy
- store an image of an area of the screen in window coordinates into memory
_imagesize
- get the size of a screen area
_imagesize_w
- get the size of a screen area in window coordinates
_imagesize_wxy
- get the size of a screen area in window coordinates
_putimage
- display an image from memory on the screen
_putimage_w
- display an image from memory on the screen using window coordinates
Font Manipulation Routines
These routines are for the display of fonts compatible with Microsoft Windows. Fonts are contained in files with
an extension of .FON. Before font based text can be displayed, the fonts must be registered with the _registerfonts
routine, and a font must be selected with the _setfont routine.
The following routines are defined:
- _getfontinfo
- get information about the currently selected font
_getgtextextent
- get the length in pixels of a text string
_getgtextvector
- get the current value of the font text orientation vector
_outgtext
- display a string of text in the current font
_registerfonts
- initialize the font graphics system
_setfont
- select a font from among the registered fonts
_setgtextvector
- set the font text orientation vector
_unregisterfonts
- frees memory allocated by the font graphics system
Presentation Graphics Routines
These routines provide a system for displaying and manipulating presentation graphics elements such as bar charts and
pie charts. The presentation graphics routines can be further divided into three classes:
- Display Routines
-
These routines are for the initialization of the presentation graphics system and the displaying of charts.
Analyze Routines
-
These routines calculate default values for chart elements without actually displaying the chart.
Utility Routines
-
These routines provide additional support to control the appearance of presentation graphics elements.
The following subsections describe these routine classes in more detail. Each routine in the class is noted with
a brief description of its purpose.
Display Routines
These routines are for the initialization of the presentation graphics system and the displaying of charts. The
_pg_initchart routine initializes the system and should be the first presentation graphics routine
called. The single-series routines display a single set of data on a chart; the multi-series routines (those ending
with ms) display several sets of data on the same chart.
The following routines are defined:
- _pg_chart
- display a bar, column or line chart
_pg_chartms
- display a multi-series bar, column or line chart
_pg_chartpie
- display a pie chart
_pg_chartscatter
- display a scatter chart
_pg_chartscatterms
- display a multi-series scatter chart
_pg_defaultchart
- initialize the chart environment for a specific chart type
_pg_initchart
- initialize the presentation graphics system
Analyze Routines
These routines calculate default values for chart elements without actually displaying the chart. The routines ending
with ms analyze multi-series charts; the others analyze single-series charts.
The following routines are defined:
- _pg_analyzechart
- analyze a bar, column or line chart
_pg_analyzechartms
- analyze a multi-series bar, column or line chart
_pg_analyzepie
- analyze a pie chart
_pg_analyzescatter
- analyze a scatter chart
_pg_analyzescatterms
- analyze a multi-series scatter chart
Utility Routines
These routines provide additional support to control the appearance of presentation graphics elements.
The following routines are defined:
- _pg_getchardef
- get bit-map definition for a specific character
_pg_getpalette
- get presentation graphics palette (colors, line styles, fill patterns and plot characters)
_pg_getstyleset
- get presentation graphics style-set (line styles for window borders and grid lines)
_pg_hlabelchart
- display text horizontally on a chart
_pg_resetpalette
- reset presentation graphics palette to default values
_pg_resetstyleset
- reset presentation graphics style-set to default values
_pg_setchardef
- set bit-map definition for a specific character
_pg_setpalette
- set presentation graphics palette (colors, line styles, fill patterns and plot characters)
_pg_setstyleset
- set presentation graphics style-set (line styles for window borders and grid lines)
_pg_vlabelchart
- display text vertically on a chart
Include Files
All program modules which use the Graphics Library should include the file graphapi.fi. This file contains
definitions of all the routines in the library. As well, each routine should include graph.fi which contains
all the structure and constant definitions.
Modules using the presentation graphics routines should also include the file pgapi.fi. As well, each
routine should include pg.fi.
Graphics Library Routines
This chapter contains, in alphabetical order, descriptions of the routines which comprise the graphics library.
Each description consists of a number of subsections:
- Synopsis:
-
This subsection gives an example of a declaration for the routine, showing the types of the routine and its arguments.
Description:
-
This subsection is a description of the routine.
Returns:
-
This subsection describes the return value (if any) for the routine.
See Also:
-
This subsection provides a list of related routines.
Example:
-
This subsection consists of an example program demonstrating the use of the routine. In some cases the output from
the program is also displayed.
Classification:
-
This subsection provides an indication of where the routine is commonly found. The following notation is used:
- PC Graphics
- These &routiness are part of the PC graphics library.
Systems:
- This subsection provides an indication of where the routine is supported. The following notation is used:
- DOS
- This routine is available on both 16-bit DOS and 32-bit extended DOS.
QNX
- This routine is available on QNX Software Systems' 16 or 32-bit operating systems.
_arc, _arc_w, _arc_wxy
- Synopsis:
-
integer*2 function _arc( x1, y1, x2, y2,
x3, y3, x4, y4 )
integer*2 x1, y1
integer*2 x2, y2
integer*2 x3, y3
integer*2 x4, y4
integer*2 function _arc_w( x1, y1, x2, y2,
x3, y3, x4, y4 )
double precision x1, y1
double precision x2, y2
double precision x3, y3
double precision x4, y4
integer*2 function _arc_wxy( p1, p2, p3, p4 )
record /_wxycoord/ p1
record /_wxycoord/ p2
record /_wxycoord/ p3
record /_wxycoord/ p4
- Description:
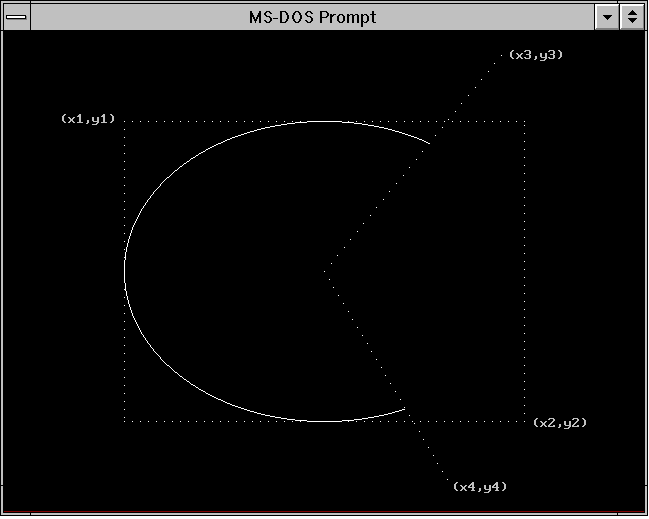
- The _arc routines draw elliptical arcs. The _arc routine uses the view coordinate system. The
_arc_w and _arc_wxy routines use the window coordinate system.
The center of the arc is the center of the rectangle established by the points (x1,y1) and (x2,y2).
The arc is a segment of the ellipse drawn within this bounding rectangle. The arc starts at the point on this
ellipse that intersects the vector from the centre of the ellipse to the point (x3,y3). The arc ends at the
point on this ellipse that intersects the vector from the centre of the ellipse to the point (x4,y4). The
arc is drawn in a counter-clockwise direction with the current plot action using the current color and the current line style.
The following picture illustrates the way in which the bounding rectangle and the vectors specifying the start and
end points are defined.
When the coordinates (x1,y1) and (x2,y2) establish a line or a point (this happens when one or more
of the x-coordinates or y-coordinates are equal), nothing is drawn.
The current output position for graphics output is set to be the point at the end of the arc that was drawn.
- Returns:
- The _arc routines return a non-zero value when the arc was successfully drawn; otherwise, zero is returned.
- See Also:
- _ellipse, _pie, _rectangle, _getarcinfo,
_setcolor, _setlinestyle, _setplotaction
- Example:
-
include 'graphapi.fi'
include 'graph.fi'
call _setvideomode( _VRES16COLOR )
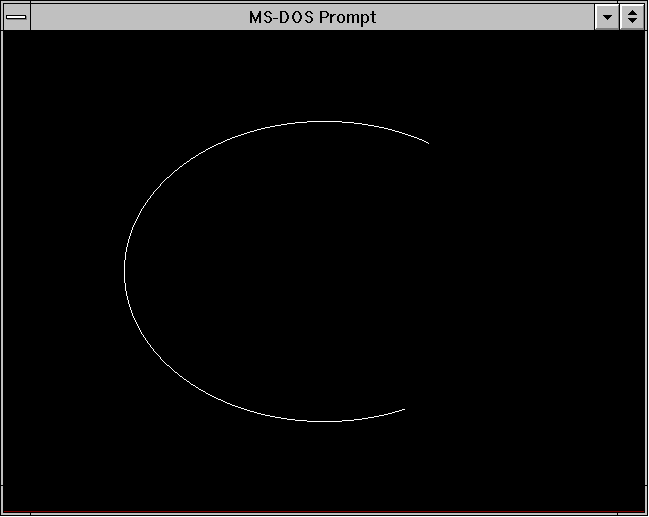
call _arc( 120, 90, 520, 390, 500, 20, 450, 460 )
pause
call _setvideomode( _DEFAULTMODE )
end
produces the following:
- Classification:
- PC Graphics
- Systems:
- _arc - DOS
_arc_w - DOS
_arc_wxy - DOS
_clearscreen
- Synopsis:
-
subroutine _clearscreen( area )
integer*2 area
- Description:
- The _clearscreen routine clears the indicated area and fills it with the background color. The area
argument must be one of the following values:
- _GCLEARSCREEN
- area is entire screen
_GVIEWPORT
- area is current viewport or clip region
_GWINDOW
- area is current text window
- See Also:
- _setbkcolor, _setviewport, _setcliprgn,
_settextwindow
- Example:
-
include 'graphapi.fi'
include 'graph.fi'
call _setvideomode( _VRES16COLOR )
call _rectangle( _GFILLINTERIOR,
+
100, 100, 540, 380 )
pause
call _setviewport( 200, 200, 440, 280 )
call _clearscreen( _GVIEWPORT )
pause
call _setvideomode( _DEFAULTMODE )
end
- Classification:
- PC Graphics
- Systems:
- DOS
_displaycursor
- Synopsis:
-
integer*2 function _displaycursor( mode )
integer*2 mode
- Description:
- The _displaycursor routine is used to establish whether the text cursor is to be displayed when graphics routines
complete. On entry to a graphics routine, the text cursor is turned off. When the routine completes, the mode
setting determines whether the cursor is turned back on. The mode argument can have one of the following values:
- _GCURSORON
- the cursor will be displayed
_GCURSOROFF
- the cursor will not be displayed
- Returns:
- The _displaycursor routine returns the previous setting for mode.
- See Also:
- _gettextcursor, _settextcursor
- Example:
-
include 'graphapi.fi'
include 'graph.fi'
character*30 name
call _setvideomode( _TEXTC80 )
call _settextposition( 2, 1 )
call _displaycursor( _GCURSORON )
call _outtext( 'Cursor ON'//char(10)//char(10)
+
//'Enter your name >'c )
read( *, '(a30)' ) name
call _displaycursor( _GCURSOROFF )
call _settextposition( 6, 1 )
call _outtext( 'Cursor OFF'//char(10)//char(10)
+
//'Enter your name >'c )
read( *, '(a30)' ) name
call _setvideomode( _DEFAULTMODE )
end
- Classification:
- PC Graphics
- Systems:
- DOS
_ellipse, _ellipse_w, _ellipse_wxy
- Synopsis:
-
integer*2 function _ellipse( fill, x1, y1, x2, y2 )
integer*2 fill
integer*2 x1, y1
integer*2 x2, y2
integer*2 function _ellipse_w( fill, x1, y1, x2, y2 )
integer*2 fill,
double precision x1, y1
double precision x2, y2
integer*2 function _ellipse_wxy( fill, p1, p2 )
integer*2 fill,
record /_wxycoord/ p1, p2
- Description:
- The _ellipse routines draw ellipses. The _ellipse routine uses the view coordinate system. The
_ellipse_w and _ellipse_wxy routines use the window coordinate system.
The center of the ellipse is the center of the rectangle established by the points (x1,y1) and (x2,y2).
The argument fill determines whether the ellipse is filled in or has only its outline drawn. The argument
can have one of two values:
- _GFILLINTERIOR
- fill the interior by writing pixels with the current plot action using the current color and the current fill mask
_GBORDER
- leave the interior unchanged; draw the outline of the figure with the current plot action using the current color and line
style
When the coordinates (x1,y1) and (x2,y2) establish a line or a point (this happens when one or more
of the x-coordinates or y-coordinates are equal), nothing is drawn.
- Returns:
- The _ellipse routines return a non-zero value when the ellipse was successfully drawn; otherwise, zero is returned.
- See Also:
- _arc, _rectangle, _setcolor, _setfillmask,
_setlinestyle, _setplotaction
- Example:
-
include 'graphapi.fi'
include 'graph.fi'
call _setvideomode( _VRES16COLOR )
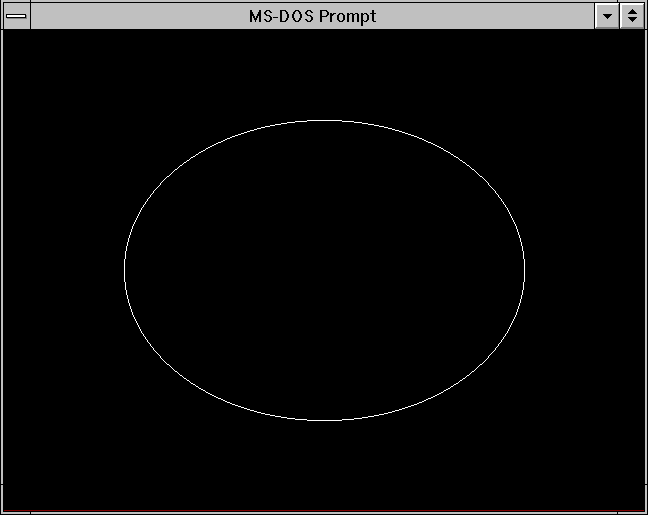
call _ellipse( _GBORDER, 120, 90, 520, 390 )
pause
call _setvideomode( _DEFAULTMODE )
end
produces the following:
- Classification:
- PC Graphics
- Systems:
- _ellipse - DOS
_ellipse_w - DOS
_ellipse_wxy - DOS
_floodfill, _floodfill_w
- Synopsis:
-
integer*2 function _floodfill( x, y, stop_color )
integer*2 x, y
integer*2 stop_color
integer*2 function _floodfill_w( x, y, stop_color )
double precision x, y
integer*2 stop_color
- Description:
- The _floodfill routines fill an area of the screen. The _floodfill routine uses the view coordinate
system. The _floodfill_w routine uses the window coordinate system.
The filling starts at the point (x,y) and continues in all directions: when a pixel is filled, the neighbouring
pixels (horizontally and vertically) are then considered for filling. Filling is done using the current color and fill
mask. No filling will occur if the point (x,y) lies outside the clipping region.
If the argument stop_color is a valid pixel value, filling will occur in each direction until a pixel is encountered
with a pixel value of stop_color. The filled area will be the area around (x,y), bordered by stop_color.
No filling will occur if the point (x,y) has the pixel value stop_color.
If stop_color has the value (-1), filling occurs until a pixel is encountered with a pixel value different
from the pixel value of the starting point (x,y). No filling will occur if the pixel value of the point
(x,y) is the current color.
- Returns:
- The _floodfill routines return zero when no filling takes place; a non-zero value is returned to indicate that filling
has occurred.
- See Also:
- _setcliprgn, _setcolor, _setfillmask, _setplotaction
- Example:
-
include 'graphapi.fi'
include 'graph.fi'
call _setvideomode( _VRES16COLOR )
call _setcolor( 1 )
call _ellipse( _GBORDER, 120, 90, 520, 390 )
call _setcolor( 2 )
call _floodfill( 320, 240, 1 )
pause
call _setvideomode( _DEFAULTMODE )
end
- Classification:
- PC Graphics
- Systems:
- _floodfill - DOS
_floodfill_w - DOS
_getactivepage
- Synopsis:
-
integer*2 function _getactivepage()
- Description:
- The _getactivepage routine returns the number of the currently selected active graphics page.
Only some combinations of video modes and hardware allow multiple pages of graphics to exist. When multiple pages
are supported, the active page may differ from the visual page. The graphics information in the visual page determines
what is displayed upon the screen. Animation may be accomplished by alternating the visual page. A graphics page
can be constructed without affecting the screen by setting the active page to be different than the visual page.
The number of available video pages can be determined by using the _getvideoconfig
routine. The default video page is 0.
- Returns:
- The _getactivepage routine returns the number of the currently selected active graphics page.
- See Also:
- _setactivepage, _setvisualpage, _getvisualpage,
_getvideoconfig
- Example:
-
include 'graphapi.fi'
include 'graph.fi'
integer old_apage, old_vpage
call _setvideomode( _HRES16COLOR )
old_apage = _getactivepage()
old_vpage = _getvisualpage()
! draw an ellipse on page 0
call _setactivepage( 0 )
call _setvisualpage( 0 )
call _ellipse( _GFILLINTERIOR, 100, 50,
+
540, 150 )
! draw a rectangle on page 1
call _setactivepage( 1 )
call _rectangle( _GFILLINTERIOR, 100, 50,
+
540, 150
)
pause
! display page 1
call _setvisualpage( 1 )
pause
call _setactivepage( old_apage )
call _setvisualpage( old_vpage )
call _setvideomode( _DEFAULTMODE )
end
- Classification:
- PC Graphics
- Systems:
- DOS
_getarcinfo
- Synopsis:
-
integer*2 function _getarcinfo( start_pt, end_pt,
inside_pt )
record /xycoord/ start_pt
record /xycoord/ end_pt
record /xycoord/ inside_pt
- Description:
- The _getarcinfo routine returns information about the arc most recently drawn by the _arc or
_pie routines. The arguments start_pt and end_pt are set to contain the endpoints
of the arc. The argument inside_pt will contain the coordinates of a point within the pie. The points
are all specified in the view coordinate system.
The endpoints of the arc can be used to connect other lines to the arc. The interior point can be used to fill the
pie.
- Returns:
- The _getarcinfo routine returns a non-zero value when successful. If the previous arc or pie was not successfully
drawn, zero is returned.
- See Also:
- _arc, _pie
- Example:
-
include 'graphapi.fi'
include 'graph.fi'
record /xycoord/ start_pt, end_pt, inside_pt
call _setvideomode( _VRES16COLOR )
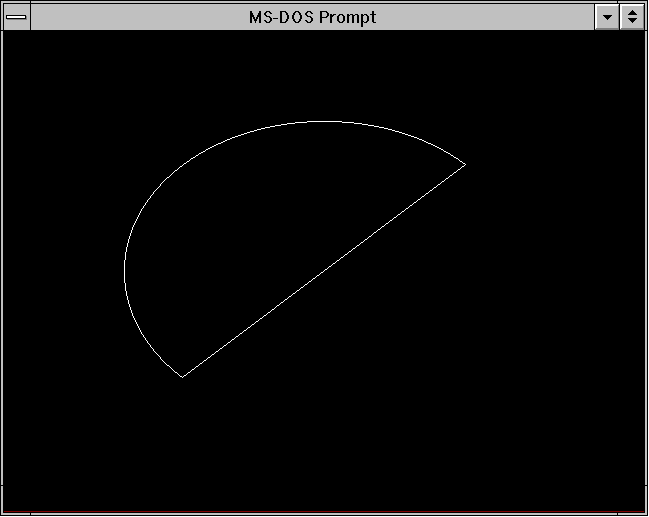
call _arc( 120, 90, 520, 390, 520, 90, 120, 390 )
call _getarcinfo( start_pt, end_pt, inside_pt )
call _moveto( start_pt.xcoord, start_pt.ycoord )
call _lineto( end_pt.xcoord, end_pt.ycoord )
pause
call _setvideomode( _DEFAULTMODE )
end
produces the following:
- Classification:
- PC Graphics
- Systems:
- DOS
_getbkcolor
- Synopsis:
-
integer*4 function _getbkcolor()
- Description:
- The _getbkcolor routine returns the current background color. In text modes, the background color controls
the area behind each individual character. In graphics modes, the background refers to the entire screen. The
default background color is 0.
- Returns:
- The _getbkcolor routine returns the current background color.
- See Also:
- _setbkcolor, _remappalette
- Example:
-
include 'graphapi.fi'
include 'graph.fi'
integer bk, old_bk
integer colors(16)/
+ _BLACK, _BLUE, _GREEN,
+ _CYAN, _RED, _MAGENTA,
+ _BROWN, _WHITE, _GRAY, _LIGHTBLUE,
+ _LIGHTGREEN, _LIGHTCYAN, _LIGHTRED,
+ _LIGHTMAGENTA, _YELLOW, _BRIGHTWHITE/
call _setvideomode( _VRES16COLOR )
old_bk = _getbkcolor()
do bk = 1, 16
call _setbkcolor( colors( bk ) )
pause
enddo
call _setbkcolor( old_bk )
call _setvideomode( _DEFAULTMODE )
end
- Classification:
- PC Graphics
- Systems:
- DOS
_getcliprgn
- Synopsis:
-
subroutine _getcliprgn( x1, y1, x2, y2 )
integer*2 x1, y1
integer*2 x2, y2
- Description:
- The _getcliprgn routine returns the location of the current clipping region. A clipping region is defined with
the _setcliprgn or _setviewport routines. By default, the clipping
region is the entire screen.
The current clipping region is a rectangular area of the screen to which graphics output is restricted. The top
left corner of the clipping region is placed in the arguments (x1,y1). The bottom right corner of the clipping
region is placed in (x2,y2).
- See Also:
- _setcliprgn, _setviewport
- Example:
-
include 'graphapi.fi'
include 'graph.fi'
integer*2 x1, y1, x2, y2
call _setvideomode( _VRES16COLOR )
call _getcliprgn( x1, y1, x2, y2 )
call _setcliprgn( 130, 100, 510, 380 )
call _ellipse( _GBORDER, 120, 90, 520, 390 )
pause
call _setcliprgn( x1, y1, x2, y2 )
call _setvideomode( _DEFAULTMODE )
end
- Classification:
- PC Graphics
- Systems:
- DOS
_getcolor
- Synopsis:
-
integer*2 function _getcolor()
- Description:
- The _getcolor routine returns the pixel value for the current color. This is the color used for displaying
graphics output. The default color value is one less than the maximum number of colors in the current video mode.
- Returns:
- The _getcolor routine returns the pixel value for the current color.
- See Also:
- _setcolor
- Example:
-
include 'graphapi.fi'
include 'graph.fi'
integer col, old_col
call _setvideomode( _VRES16COLOR )
old_col = _getcolor()
do col = 0, 15
call _setcolor( col )
call _rectangle( _GFILLINTERIOR,
+
100, 100, 540, 380 )
pause
enddo
call _setcolor( old_col )
call _setvideomode( _DEFAULTMODE )
end
- Classification:
- PC Graphics
- Systems:
- DOS
_getcurrentposition, _getcurrentposition_w
- Synopsis:
-
record /xycoord/ function _getcurrentposition()
record /_wxycoord/ function _getcurrentposition_w()
- Description:
- The _getcurrentposition routines return the current output position for graphics. The _getcurrentposition
routine returns the point in view coordinates. The _getcurrentposition_w routine returns the point in window
coordinates.
The current position defaults to the origin, (0,0), when a new video mode is selected. It is changed by
successful calls to the _arc, _moveto and _lineto routines
as well as the _setviewport routine.
Note that the output position for graphics output differs from that for text output. The output position for
text output can be set by use of the _settextposition routine.
- Returns:
- The _getcurrentposition routines return the current output position for graphics.
- See Also:
- _moveto, _settextposition
- Example:
-
include 'graphapi.fi'
include 'graph.fi'
record /xycoord/ old_pos
call _setvideomode( _VRES16COLOR )
old_pos = _getcurrentposition()
call _moveto( 100, 100 )
call _lineto( 540, 100 )
call _lineto( 320, 380 )
call _lineto( 100, 100 )
call _moveto( old_pos.xcoord, old_pos.ycoord )
pause
call _setvideomode( _DEFAULTMODE )
end
- Classification:
- PC Graphics
- Systems:
- _getcurrentposition - DOS
_getcurrentposition_w - DOS
_getfillmask
- Synopsis:
-
subroutine _getfillmask( mask )
integer*1 mask(8)
- Description:
- The _getfillmask routine copies the current fill mask into the area located by the argument mask. The
fill mask is used by the _ellipse, _floodfill, _pie,
_polygon and _rectangle routines that fill an area of the screen.
The fill mask is an eight-byte array which is interpreted as a square pattern (8 by 8) of 64 bits. Each bit in the
mask corresponds to a pixel. When a region is filled, each point in the region is mapped onto the fill mask.
When a bit from the mask is one, the pixel value of the corresponding point is set using the current plotting action with
the current color; when the bit is zero, the pixel value of that point is not affected.
When the fill mask is not set, a fill operation will set all points in the fill region to have a pixel value of the
current color.
- See Also:
- _floodfill, _setfillmask, _setplotaction
- Example:
-
include 'graphapi.fi'
include 'graph.fi'
integer*1 old_mask(8)
integer*1 new_mask(8)/
+
'81'x, '42'x, '24'x, '18'x,
+
'18'x, '24'x, '42'x, '81'x/
call _setvideomode( _VRES16COLOR )
call _getfillmask( old_mask )
call _setfillmask( new_mask )
call _rectangle( _GFILLINTERIOR,
+
100, 100, 540, 380 )
call _setfillmask( old_mask )
pause
call _setvideomode( _DEFAULTMODE )
end
- Classification:
- PC Graphics
- Systems:
- DOS
_getfontinfo
- Synopsis:
-
integer*2 function _getfontinfo( info )
record /_fontinfo/ info
- Description:
- The _getfontinfo routine returns information about the currently selected font. Fonts are selected with the
_setfont routine. The font information is returned in the _fontinfo structure indicated
by the argument info. The structure contains the following fields:
- type
- 1 for a vector font, 0 for a bit-mapped font
ascent
- distance from top of character to baseline in pixels
pixwidth
- character width in pixels (0 for a proportional font)
pixheight
- character height in pixels
avgwidth
- average character width in pixels
filename
- name of the file containing the current font
facename
- name of the current font
- Returns:
- The _getfontinfo routine returns zero if the font information is returned successfully; otherwise a negative value
is returned.
- See Also:
- _registerfonts, _unregisterfonts, _setfont,
_outgtext, _getgtextextent, _setgtextvector,
_getgtextvector
- Example:
-
include 'graphapi.fi'
include 'graph.fi'
record /_fontinfo/ info
integer width
call _setvideomode( _VRES16COLOR )
call _getfontinfo( info )
call _moveto( 100, 100 )
call _outgtext( 'WATCOM Graphics'c )
width = _getgtextextent( 'WATCOM Graphics'c )
call _rectangle( _GBORDER, 100, 100,
+
100 + width, 100 + info.pixheight )
pause
call _setvideomode( _DEFAULTMODE )
end
- Classification:
- PC Graphics
- Systems:
- DOS
_getgtextextent
- Synopsis:
-
integer*2 function _getgtextextent( text )
character*(*) text
- Description:
- The _getgtextextent routine returns the length in pixels of the argument text as it would be displayed in
the current font by the routine _outgtext. Note that the text is not displayed on the screen,
only its length is determined.
- Returns:
- The _getgtextextent routine returns the length in pixels of a string.
- See Also:
- _registerfonts, _unregisterfonts, _setfont,
_getfontinfo, _outgtext, _setgtextvector,
_getgtextvector
- Example:
-
include 'graphapi.fi'
include 'graph.fi'
record /_fontinfo/ info
integer width
call _setvideomode( _VRES16COLOR )
call _getfontinfo( info )
call _moveto( 100, 100 )
call _outgtext( 'WATCOM Graphics'c )
width = _getgtextextent( 'WATCOM Graphics'c )
call _rectangle( _GBORDER, 100, 100,
+
100 + width, 100 + info.pixheight )
pause
call _setvideomode( _DEFAULTMODE )
end
- Classification:
- PC Graphics
- Systems:
- DOS
_getgtextvector
- Synopsis:
-
record /xycoord/ function _getgtextvector()
- Description:
- The _getgtextvector routine returns the current value of the text orientation vector. This is the direction
used when text is displayed by the _outgtext routine.
- Returns:
- The _getgtextvector routine returns, as an xycoord structure, the current value of the text orientation
vector.
- See Also:
- _registerfonts, _unregisterfonts, _setfont,
_getfontinfo, _outgtext, _getgtextextent,
_setgtextvector
- Example:
-
include 'graphapi.fi'
include 'graph.fi'
record /xycoord/ old_vec
call _setvideomode( _VRES16COLOR )
old_vec = _getgtextvector()
call _setgtextvector( 0, -1 )
call _moveto( 100, 100 )
call _outgtext( 'WATCOM Graphics'c )
call _setgtextvector( old_vec.xcoord, old_vec.ycoord )
pause
call _setvideomode( _DEFAULTMODE )
end
- Classification:
- PC Graphics
- Systems:
- DOS
_getimage, _getimage_w, _getimage_wxy
- Synopsis:
-
subroutine _getimage( x1, y1, x2, y2, image )
integer*2 x1, y1
integer*2 x2, y2
integer*1 image(*)
subroutine _getimage_w( x1, y1, x2, y2, image )
double precision x1, y1
double precision x2, y2
integer*1 image(*)
subroutine _getimage_wxy( p1, p2, image )
record /_wxycoord/ p1, p2
integer*1 image(*)
- Description:
- The _getimage routines store a copy of an area of the screen into the buffer indicated by the image argument.
The _getimage routine uses the view coordinate system. The _getimage_w and _getimage_wxy
routines use the window coordinate system.
The screen image is the rectangular area defined by the points (x1,y1) and (x2,y2). The buffer
image must be large enough to contain the image (the size of the image can be determined by using the _imagesize
routine). The image may be displayed upon the screen at some later time by using the _putimage
routines.
- See Also:
- _imagesize, _putimage
- Example:
-
include 'graphapi.fi'
include 'graph.fi'
integer*1 image(:)
integer y, image_size, istat
call _setvideomode( _VRES16COLOR )
call _ellipse( _GFILLINTERIOR,
+
100, 100, 200, 200 )
image_size = _imagesize( 100, 100, 201, 201 )
allocate( image(image_size), stat = istat )
if( istat .eq. 0 )then
call _getimage( 100, 100, 201, 201, image )
call _putimage( 260, 200, image, _GPSET )
call _putimage( 420, 100, image, _GPSET )
do y = 100, 280, 20
call _putimage( 420, y,
image, _GXOR )
call _putimage( 420, y+20,
image, _GXOR )
enddo
deallocate( image )
endif
pause
call _setvideomode( _DEFAULTMODE )
end
- Classification:
- PC Graphics
- Systems:
- _getimage - DOS
_getimage_w - DOS
_getimage_wxy - DOS
_getlinestyle
- Synopsis:
-
integer*2 function _getlinestyle()
- Description:
- The _getlinestyle routine returns the current line-style mask.
The line-style mask determines the style by which lines and arcs are drawn. The mask is treated as an array of 16
bits. As a line is drawn, a pixel at a time, the bits in this array are cyclically tested. When a bit in the
array is 1, the pixel value for the current point is set using the current color according to the current plotting action;
otherwise, the pixel value for the point is left unchanged. A solid line would result from a value of 'FFFF'x
and a dashed line would result from a value of 'F0F0'x.
The default line style mask is 'FFFF'x.
- Returns:
- The _getlinestyle routine returns the current line-style mask.
- See Also:
- _lineto, _pie, _rectangle, _polygon,
_setlinestyle
- Example:
-
include 'graphapi.fi'
include 'graph.fi'
integer DASHED
parameter (DASHED='f0f0'x)
integer old_style
call _setvideomode( _VRES16COLOR )
old_style = _getlinestyle()
call _setlinestyle( DASHED )
call _rectangle( _GBORDER, 100, 100, 540, 380 )
call _setlinestyle( old_style )
pause
call _setvideomode( _DEFAULTMODE )
end
- Classification:
- PC Graphics
- Systems:
- DOS
_getphyscoord
- Synopsis:
-
record /xycoord/ function _getphyscoord( x, y )
integer*2 x, y
- Description:
- The _getphyscoord routine returns the physical coordinates of the position with view coordinates (x,y).
View coordinates are defined by the _setvieworg and _setviewport
routines.
- Returns:
- The _getphyscoord routine returns the physical coordinates, as an xycoord structure, of the given point.
- See Also:
- _getviewcoord, _setvieworg, _setviewport
- Example:
-
include 'graphapi.fi'
include 'graph.fi'
record /xycoord/ pos
real urand
integer seed
seed = 75347
call _setvideomode( _VRES16COLOR )
call _setvieworg(
+ mod( int( urand( seed )*32767 ), 640 ),
+ mod( int( urand( seed )*32767 ), 480 ) )
pos = _getphyscoord( 0, 0 )
call _rectangle( _GBORDER,
+ - pos.xcoord, - pos.ycoord,
+ 639 - pos.xcoord, 479 - pos.ycoord
)
pause
call _setvideomode( _DEFAULTMODE )
end
- Classification:
- PC Graphics
- Systems:
- DOS
_getpixel, _getpixel_w
- Synopsis:
-
integer*2 function _getpixel( x, y )
integer*2 x, y
integer*2 function _getpixel_w( x, y )
double precision x, y
- Description:
- The _getpixel routines return the pixel value for the point with coordinates (x,y). The _getpixel
routine uses the view coordinate system. The _getpixel_w routine uses the window coordinate system.
- Returns:
- The _getpixel routines return the pixel value for the given point when the point lies within the clipping region;
otherwise, (-1) is returned.
- See Also:
- _setpixel
- Example:
-
include 'graphapi.fi'
include 'graph.fi'
integer x, y, i
real urand
integer seed
seed = 75347
call _setvideomode( _VRES16COLOR )
call _rectangle( _GBORDER, 100, 100, 540, 380 )
do i = 0, 60000
x = 101 + mod( int( urand( seed )*32767 ),
+
439 )
y = 101 + mod( int( urand( seed )*32767 ),
+
279 )
call _setcolor( _getpixel( x, y ) + 1 )
call _setpixel( x, y )
enddo
pause
call _setvideomode( _DEFAULTMODE )
end
- Classification:
- PC Graphics
- Systems:
- _getpixel - DOS
_getpixel_w - DOS
_getplotaction
- Synopsis:
-
integer*2 function _getplotaction()
- Description:
- The _getplotaction routine returns the current plotting action.
The drawing routines cause pixels to be set with a pixel value. By default, the value to be set is obtained by replacing
the original pixel value with the supplied pixel value. Alternatively, the replaced value may be computed as a function
of the original and the supplied pixel values.
The plotting action can have one of the following values:
- _GPSET
- replace the original screen pixel value with the supplied pixel value
_GAND
- replace the original screen pixel value with the bitwise and of the original pixel value and the supplied pixel value
_GOR
- replace the original screen pixel value with the bitwise or of the original pixel value and the supplied pixel value
_GXOR
- replace the original screen pixel value with the bitwise exclusive-or of the original pixel value and the supplied
pixel value. Performing this operation twice will restore the original screen contents, providing an efficient method
to produce animated effects.
- Returns:
- The _getplotaction routine returns the current plotting action.
- See Also:
- _setplotaction
- Example:
-
include 'graphapi.fi'
include 'graph.fi'
integer old_act
call _setvideomode( _VRES16COLOR )
old_act = _getplotaction()
call _setplotaction( _GPSET )
call _rectangle( _GFILLINTERIOR, 100, 100,
+
540, 380
)
pause
call _setplotaction( _GXOR )
call _rectangle( _GFILLINTERIOR, 100, 100,
+
540, 380
)
pause
call _setplotaction( old_act )
call _setvideomode( _DEFAULTMODE )
end
- Classification:
- PC Graphics
- Systems:
- DOS
_gettextcolor
- Synopsis:
-
integer*2 function _gettextcolor()
- Description:
- The _gettextcolor routine returns the pixel value of the current text color. This is the color used for displaying
text with the _outtext and _outmem routines. The default text color
value is set to 7 whenever a new video mode is selected.
- Returns:
- The _gettextcolor routine returns the pixel value of the current text color.
- See Also:
- _settextcolor, _setcolor, _outtext, _outmem
- Example:
-
include 'graphapi.fi'
include 'graph.fi'
integer old_col
integer old_bk
call _setvideomode( _TEXTC80 )
old_col = _gettextcolor()
old_bk = _getbkcolor()
call _settextcolor( 7 )
call _setbkcolor( _BLUE )
call _outtext( ' WATCOM '//char(10)//
+
'Graphics'c )
call _settextcolor( old_col )
call _setbkcolor( old_bk )
pause
call _setvideomode( _DEFAULTMODE )
end
- Classification:
- PC Graphics
- Systems:
- DOS
_gettextcursor
- Synopsis:
-
integer*2 function _gettextcursor()
- Description:
- The _gettextcursor routine returns the current cursor attribute, or shape. The cursor shape is set with the
_settextcursor routine. See the _settextcursor routine
for a description of the value returned by the _gettextcursor routine.
- Returns:
- The _gettextcursor routine returns the current cursor shape when successful; otherwise, (-1) is returned.
- See Also:
- _settextcursor, _displaycursor
- Example:
-
include 'graphapi.fi'
include 'graph.fi'
integer*2 old_shape
old_shape = _gettextcursor()
call _settextcursor( '0007'x )
call _outtext(
+ char(10)//'Block cursor'c )
pause
call _settextcursor( '0407'x )
call _outtext(
+ char(10)//'Half height cursor'c )
pause
call _settextcursor( '2000'x )
call _outtext(
+ char(10)//'No cursor'c )
pause
end
- Classification:
- PC Graphics
- Systems:
- DOS
_gettextextent
- Synopsis:
-
subroutine _gettextextent( x, y, text, concat, extent )
integer*2 x, y
character*(*) text
record /xycoord/ concat
record /xycoord/ extent(4)
- Description:
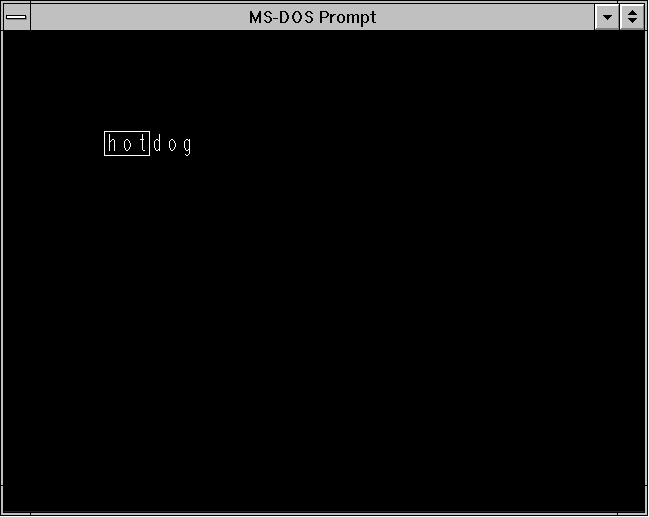
- The _gettextextent routine simulates the effect of using the _grtext routine to display the
text string text at the position (x,y), using the current text settings. The concatenation point is
returned in the argument concat. The text extent parallelogram is returned in the array extent.
The concatenation point is the position to use to output text after the given string. The text extent parallelogram
outlines the area where the text string would be displayed. The four points are returned in counter-clockwise order,
starting at the upper-left corner.
- See Also:
- _grtext, _gettextsettings
- Example:
-
include 'graphapi.fi'
include 'graph.fi'
record /xycoord/ concat, extent(4)
call _setvideomode( _VRES16COLOR )
call _grtext( 100, 100, 'hot'c )
call _gettextextent( 100, 100, 'hot'c,
+
concat, extent )
call _polygon( _GBORDER, 4, extent )
call _grtext( concat.xcoord, concat.ycoord,
+
'dog'c )
pause
call _setvideomode( _DEFAULTMODE )
end
produces the following:
- Classification:
- PC Graphics
- Systems:
- DOS
_gettextposition
- Synopsis:
-
record /rccoord/ function _gettextposition()
- Description:
- The _gettextposition routine returns the current output position for text. This position is in terms of characters,
not pixels.
The current position defaults to the top left corner of the screen, (1,1), when a new video mode is selected.
It is changed by successful calls to the _outtext, _outmem, _settextposition
and _settextwindow routines.
Note that the output position for graphics output differs from that for text output. The output position for
graphics output can be set by use of the _moveto routine.
- Returns:
- The _gettextposition routine returns, as an rccoord structure, the current output position for text.
- See Also:
- _outtext, _outmem, _settextposition, _settextwindow,
_moveto
- Example:
-
include 'graphapi.fi'
include 'graph.fi'
record /rccoord/ old_pos
call _setvideomode( _TEXTC80 )
old_pos = _gettextposition()
call _settextposition( 10, 40 )
call _outtext( 'WATCOM Graphics'c )
call _settextposition( old_pos.row, old_pos.col )
pause
call _setvideomode( _DEFAULTMODE )
end
- Classification:
- PC Graphics
- Systems:
- DOS
_gettextsettings
- Synopsis:
-
subroutine _gettextsettings( settings )
record /textsettings/ settings
- Description:
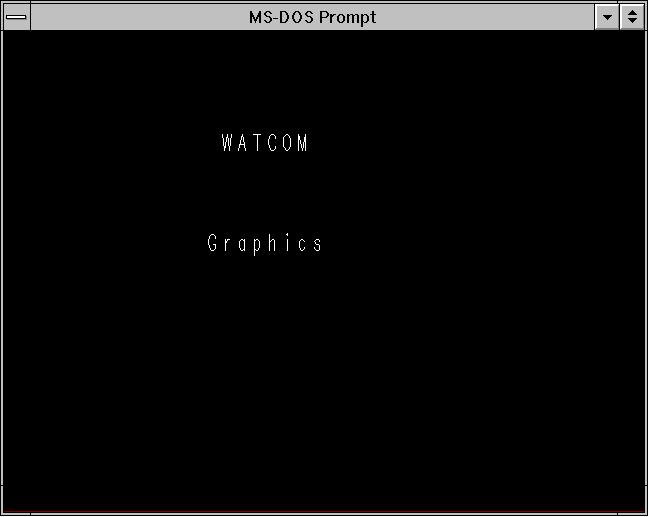
- The _gettextsettings routine returns information about the current text settings used when text is displayed by the
_grtext routine. The information is stored in the textsettings structure indicated
by the argument settings. The structure contains the following fields (all are integer*2 fields):
- basevectorx
- x-component of the current base vector
basevectory
- y-component of the current base vector
path
- current text path
height
- current text height (in pixels)
width
- current text width (in pixels)
spacing
- current text spacing (in pixels)
horizalign
- horizontal component of the current text alignment
vertalign
- vertical component of the current text alignment
- See Also:
- _grtext, _setcharsize, _setcharspacing,
_settextalign, _settextpath, _settextorient
- Example:
-
include 'graphapi.fi'
include 'graph.fi'
record /textsettings/ ts
call _setvideomode( _VRES16COLOR )
call _gettextsettings( ts )
call _grtext( 100, 100, 'WATCOM'c )
call _setcharsize( 2 * ts.height, 2 * ts.width )
call _grtext( 100, 300, 'Graphics'c )
call _setcharsize( ts.height, ts.width )
pause
call _setvideomode( _DEFAULTMODE )
end
- Classification:
- PC Graphics
- Systems:
- DOS
_gettextwindow
- Synopsis:
-
subroutine _gettextwindow( row1, col1, row2, col2 )
integer*2 row1, col1
integer*2 row2, col2
- Description:
- The _gettextwindow routine returns the location of the current text window. A text window is defined with the
_settextwindow routine. By default, the text window is the entire screen.
The current text window is a rectangular area of the screen. Text display is restricted to be within this window.
The top left corner of the text window is placed in the arguments (row1,col1). The bottom right corner
of the text window is placed in (row2,col2).
- See Also:
- _settextwindow, _outtext, _outmem, _settextposition,
_scrolltextwindow
- Example:
-
include 'graphapi.fi'
include 'graph.fi'
integer i
integer*2 r1, c1, r2, c2
character*80 buff
call _setvideomode( _TEXTC80 )
call _gettextwindow( r1, c1, r2, c2 )
call _settextwindow( 5, 20, 20, 40 )
do i = 1, 20
write( buff, '(''Line '', i2, a1, a1 )' )
+ i, char(10), char(0)
call _outtext( buff )
enddo
pause
call _settextwindow( r1, c1, r2, c2 )
call _setvideomode( _DEFAULTMODE )
end
- Classification:
- PC Graphics
- Systems:
- DOS
_getvideoconfig
- Synopsis:
-
subroutine _getvideoconfig( config )
record /videoconfig/ config
- Description:
- The _getvideoconfig routine returns information about the current video mode and the hardware configuration.
The information is returned in the videoconfig structure indicated by the argument config. The structure
contains the following fields (all are integer*2 fields):
- numxpixels
- number of pixels in x-axis
numypixels
- number of pixels in y-axis
numtextcols
- number of text columns
numtextrows
- number of text rows
numcolors
- number of actual colors
bitsperpixel
- number of bits in a pixel value
numvideopages
- number of video pages
mode
- current video mode
adapter
- adapter type
monitor
- monitor type
memory
- number of kilobytes (1024 characters) of video memory
The adapter field will contain one of the following values:
- _NODISPLAY
- no display adapter attached
_UNKNOWN
- unknown adapter/monitor type
_MDPA
- Monochrome Display/Printer Adapter
_CGA
- Color Graphics Adapter
_HERCULES
- Hercules Monochrome Adapter
_MCGA
- Multi-Color Graphics Array
_EGA
- Enhanced Graphics Adapter
_VGA
- Video Graphics Array
_SVGA
- SuperVGA Adapter
The monitor field will contain one of the following values:
- _MONO
- regular monochrome
_COLOR
- regular color
_ENHANCED
- enhanced color
_ANALOGMONO
- analog monochrome
_ANALOGCOLOR
- analog color
The amount of memory reported by _getvideoconfig will not always be correct for SuperVGA adapters. Since
it is not always possible to determine the amount of memory, _getvideoconfig will always report 256K, the minimum
amount.
- See Also:
- _setvideomode, _setvideomoderows
- Example:
-
include 'graphapi.fi'
include 'graph.fi'
integer mode
record /videoconfig/ vc
character*80 buff
call _getvideoconfig( vc )
select( vc.adapter )
case( _VGA, _SVGA )
mode = _VRES16COLOR
case( _MCGA )
mode = _MRES256COLOR
case( _EGA )
if( vc.monitor .eq. _MONO )then
mode = _ERESNOCOLOR
else
mode = _ERESCOLOR
endif
case( _CGA )
mode = _MRES4COLOR
case( _HERCULES )
mode = _HERCMONO
case default
stop 'No graphics adapter'
endselect
if( _setvideomode( mode ) .ne. 0 )then
call _getvideoconfig( vc )
write( buff,
+ '( i3, '' x '',
i3, '' x '', i3, a1 )' )
+ vc.numxpixels,
vc.numypixels,
+ vc.numcolors, char(0)
call _outtext( buff )
pause
call _setvideomode( _DEFAULTMODE )
endif
end
- Classification:
- PC Graphics
- Systems:
- DOS
_getviewcoord, _getviewcoord_w, _getviewcoord_wxy
- Synopsis:
-
record /xycoord/ function _getviewcoord( x, y )
integer*2 x, y
record /xycoord/ function _getviewcoord_w( x, y )
double precision x, y
record /xycoord/ function _getviewcoord_wxy( p )
record /_wxycoord/ p
- Description:
- The _getviewcoord routines translate a point from one coordinate system to viewport coordinates. The _getviewcoord
routine translates the point (x,y) from physical coordinates. The _getviewcoord_w and _getviewcoord_wxy
routines translate the point from the window coordinate system.
Viewport coordinates are defined by the _setvieworg and _setviewport
routines. Window coordinates are defined by the _setwindow routine.
- Returns:
- The _getviewcoord routines return the viewport coordinates, as an xycoord structure, of the given point.
- See Also:
- _getphyscoord, _setvieworg, _setviewport,
_setwindow
- Example:
-
include 'graphapi.fi'
include 'graph.fi'
record /xycoord/ pos1, pos2
integer seed
real urand
seed = 75347
call _setvideomode( _VRES16COLOR )
call _setvieworg(
+ mod( int( urand( seed )*32767 ), 640 ),
+ mod( int( urand( seed )*32767 ), 480 ) )
pos1 = _getviewcoord( 0, 0 )
pos2 = _getviewcoord( 639, 479 )
call _rectangle( _GBORDER,
+
pos1.xcoord, pos1.ycoord,
+
pos2.xcoord, pos2.ycoord )
pause
call _setvideomode( _DEFAULTMODE )
end
- Classification:
- PC Graphics
- Systems:
- _getviewcoord - DOS
_getviewcoord_w - DOS
_getviewcoord_wxy - DOS
_getvisualpage
- Synopsis:
-
integer*2 function _getvisualpage()
- Description:
- The _getvisualpage routine returns the number of the currently selected visual graphics page.
Only some combinations of video modes and hardware allow multiple pages of graphics to exist. When multiple pages
are supported, the active page may differ from the visual page. The graphics information in the visual page determines
what is displayed upon the screen. Animation may be accomplished by alternating the visual page. A graphics page
can be constructed without affecting the screen by setting the active page to be different than the visual page.
The number of available video pages can be determined by using the _getvideoconfig
routine. The default video page is 0.
- Returns:
- The _getvisualpage routine returns the number of the currently selected visual graphics page.
- See Also:
- _setvisualpage, _setactivepage, _getactivepage,
_getvideoconfig
- Example:
-
include 'graphapi.fi'
include 'graph.fi'
integer old_apage, old_vpage
call _setvideomode( _HRES16COLOR )
old_apage = _getactivepage()
old_vpage = _getvisualpage()
! draw an ellipse on page 0
call _setactivepage( 0 )
call _setvisualpage( 0 )
call _ellipse( _GFILLINTERIOR, 100, 50,
+
540, 150 )
! draw a rectangle on page 1
call _setactivepage( 1 )
call _rectangle( _GFILLINTERIOR, 100, 50,
+
540, 150
)
pause
! display page 1
call _setvisualpage( 1 )
pause
call _setactivepage( old_apage )
call _setvisualpage( old_vpage )
call _setvideomode( _DEFAULTMODE )
end
- Classification:
- PC Graphics
- Systems:
- DOS
_getwindowcoord
- Synopsis:
-
record /_wxycoord/ function _getwindowcoord( x, y )
integer*2 x, y
- Description:
- The _getwindowcoord routine returns the window coordinates of the position with view coordinates (x,y).
Window coordinates are defined by the _setwindow routine.
- Returns:
- The _getwindowcoord routine returns the window coordinates, as a _wxycoord structure, of the given point.
- See Also:
- _setwindow, _getviewcoord
- Example:
-
include 'graphapi.fi'
include 'graph.fi'
record /xycoord/ centre
record /_wxycoord/ pos1, pos2
call _setvideomode( _MAXRESMODE )
! draw a box 50 pixels square
! in the middle of the screen
centre = _getviewcoord_w( 0.5, 0.5 )
pos1 = _getwindowcoord( centre.xcoord - 25,
+
centre.ycoord - 25 )
pos2 = _getwindowcoord( centre.xcoord + 25,
+
centre.ycoord + 25 )
call _rectangle_wxy( _GBORDER, pos1, pos2 )
pause
call _setvideomode( _DEFAULTMODE )
end
- Classification:
- PC Graphics
- Systems:
- DOS
_grstatus
- Synopsis:
-
integer*2 function _grstatus()
- Description:
- The _grstatus routine returns the status of the most recently called graphics library routine. The routine
can be called after any graphics routine to determine if any errors or warnings occurred. The routine returns 0 if
the previous routine was successful. Values less than 0 indicate an error occurred; values greater than 0 indicate
a warning condition.
The following values can be returned:
Constant Value
Explanation
_GROK
0 no error
_GRERROR
-1 graphics error
_GRMODENOTSUPPORTED -2 video mode not supported
_GRNOTINPROPERMODE -3 routine n/a in this mode
_GRINVALIDPARAMETER -4 invalid parameter(s)
_GRINSUFFICIENTMEMORY -5 out of memory
_GRFONTFILENOTFOUND -6 can't open font file
_GRINVALIDFONTFILE -7 font file has invalid format
_GRNOOUTPUT 1
nothing was done
_GRCLIPPED
2 output clipped
- Returns:
- The _grstatus routine returns the status of the most recently called graphics library routine.
- Example:
-
include 'graphapi.fi'
include 'graph.fi'
integer x, y
real urand
integer seed
seed = 75347
call _setvideomode( _VRES16COLOR )
while( _grstatus() .eq. _GROK )do
x = mod( int( urand( seed )*32767 ), 700 )
y = mod( int( urand( seed )*32767 ), 500 )
call _setpixel( x, y )
endwhile
pause
call _setvideomode( _DEFAULTMODE )
end
- Classification:
- PC Graphics
- Systems:
- DOS
_grtext, _grtext_w
- Synopsis:
-
integer*2 function _grtext( x, y, text )
integer*2 x, y
character*(*) text
integer*2 function _grtext_w( x, y, text )
double precision x, y
character*(*) text
- Description:
- The _grtext routines display a character string. The _grtext routine uses the view coordinate system.
The _grtext_w routine uses the window coordinate system.
The character string text is displayed at the point (x,y). The string must be terminated by a null
character (char(0)). The text is displayed in the current color using the current text settings.
The graphics library can display text in three different ways.
- The _outtext and _outmem routines can be used in any video mode.
However, this variety of text can be displayed in only one size.
- The _grtext routine displays text as a sequence of line segments, and can be drawn in different
sizes, with different orientations and alignments.
- The _outgtext routine displays text in the currently selected font. Both bit-mapped and
vector fonts are supported; the size and type of text depends on the fonts that are available.
- Returns:
- The _grtext routines return a non-zero value when the text was successfully drawn; otherwise, zero is returned.
- See Also:
- _outtext, _outmem, _outgtext, _setcharsize,
_settextalign, _settextpath, _settextorient,
_setcharspacing
- Example:
-
include 'graphapi.fi'
include 'graph.fi'
call _setvideomode( _VRES16COLOR )
call _grtext( 200, 100, ' WATCOM'c )
call _grtext( 200, 200, 'Graphics'c )
pause
call _setvideomode( _DEFAULTMODE )
end
produces the following:
- Classification:
- PC Graphics
- Systems:
- _grtext - DOS
_grtext_w - DOS
_imagesize, _imagesize_w, _imagesize_wxy
- Synopsis:
-
integer*4 function _imagesize( x1, y1, x2, y2 )
integer*2 x1, y1
integer*2 x2, y2
integer*4 function _imagesize_w( x1, y1, x2, y2 )
double precision x1, y1
double precision x2, y2
integer*4 function _imagesize_wxy( p1, p2 )
record /_wxycoord/ p1, p2
- Description:
- The _imagesize routines compute the number of bytes required to store a screen image. The _imagesize
routine uses the view coordinate system. The _imagesize_w and _imagesize_wxy routines use the window
coordinate system.
The screen image is the rectangular area defined by the points (x1,y1) and (x2,y2). The storage
area used by the _getimage routines must be at least this large (in bytes).
- Returns:
- The _imagesize routines return the size of a screen image.
- See Also:
- _getimage, _putimage
- Example:
-
include 'graphapi.fi'
include 'graph.fi'
integer*1 image(:)
integer y, image_size, istat
call _setvideomode( _VRES16COLOR )
call _ellipse( _GFILLINTERIOR,
+
100, 100, 200, 200 )
image_size = _imagesize( 100, 100, 201, 201 )
allocate( image(image_size), stat = istat )
if( istat .eq. 0 )then
call _getimage( 100, 100, 201, 201, image )
call _putimage( 260, 200, image, _GPSET )
call _putimage( 420, 100, image, _GPSET )
do y = 100, 280, 20
call _putimage( 420, y,
image, _GXOR )
call _putimage( 420, y+20,
image, _GXOR )
enddo
deallocate( image )
endif
pause
call _setvideomode( _DEFAULTMODE )
end
- Classification:
- PC Graphics
- Systems:
- _imagesize - DOS
_imagesize_w - DOS
_imagesize_wxy - DOS
_lineto, _lineto_w
- Synopsis:
-
integer*2 function _lineto( x, y )
integer*2 x, y
integer*2 function _lineto_w( x, y )
double precision x, y
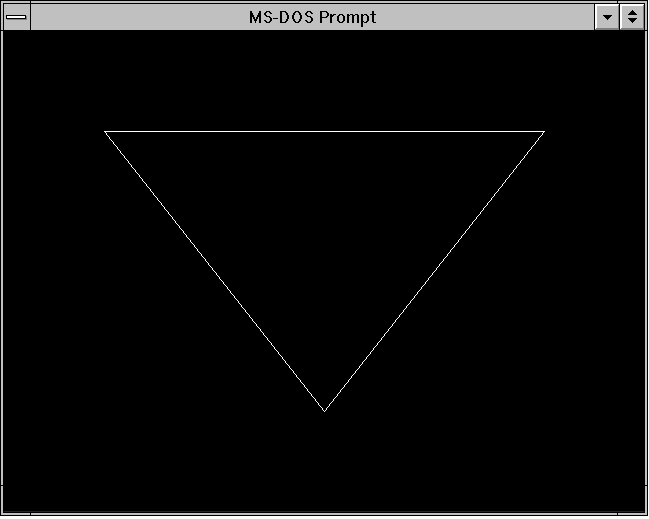
- Description:
- The _lineto routines draw straight lines. The _lineto routine uses the view coordinate system.
The _lineto_w routine uses the window coordinate system.
The line is drawn from the current position to the point at the coordinates (x,y). The point (x,y)
becomes the new current position. The line is drawn with the current plotting action using the current line style and
the current color.
- Returns:
- The _lineto routines return a non-zero value when the line was successfully drawn; otherwise, zero is returned.
- See Also:
- _moveto, _setcolor, _setlinestyle, _setplotaction
- Example:
-
include 'graphapi.fi'
include 'graph.fi'
call _setvideomode( _VRES16COLOR )
call _moveto( 100, 100 )
call _lineto( 540, 100 )
call _lineto( 320, 380 )
call _lineto( 100, 100 )
pause
call _setvideomode( _DEFAULTMODE )
end
produces the following:
- Classification:
- PC Graphics
- Systems:
- _lineto - DOS
_lineto_w - DOS
_moveto, _moveto_w
- Synopsis:
-
record /xycoord/ function _moveto( x, y )
integer*2 x, y
record /_wxycoord/ function _moveto_w( x, y )
double precision x, y
- Description:
- The _moveto routines set the current output position for graphics. The _moveto routine uses the view
coordinate system. The _moveto_w routine uses the window coordinate system.
The current output position is set to be the point at the coordinates (x,y). Nothing is drawn by the routine.
The _lineto routine uses the current output position as the starting point when a line is drawn.
Note that the output position for graphics output differs from that for text output. The output position for
text output can be set by use of the _settextposition routine.
- Returns:
- The _moveto routines return the previous value of the output position for graphics.
- See Also:
- _getcurrentposition, _lineto, _settextposition
- Example:
-
include 'graphapi.fi'
include 'graph.fi'
call _setvideomode( _VRES16COLOR )
call _moveto( 100, 100 )
call _lineto( 540, 100 )
call _lineto( 320, 380 )
call _lineto( 100, 100 )
pause
call _setvideomode( _DEFAULTMODE )
end
- Classification:
- PC Graphics
- Systems:
- _moveto - DOS
_moveto_w - DOS
_outgtext
- Synopsis:
-
subroutine _outgtext( text )
character*(*) text
- Description:
- The _outgtext routine displays the character string indicated by the argument text. The string must
be terminated by a null character (char(0)).
The string is displayed starting at the current position (see the _moveto routine) in the current
color and in the currently selected font (see the _setfont routine). The current position is
updated to follow the displayed text.
When no font has been previously selected with _setfont, a default font will be used.
The default font is an 8-by-8 bit-mapped font.
The graphics library can display text in three different ways.
- The _outtext and _outmem routines can be used in any video mode.
However, this variety of text can be displayed in only one size.
- The _grtext routine displays text as a sequence of line segments, and can be drawn in different
sizes, with different orientations and alignments.
- The _outgtext routine displays text in the currently selected font. Both bit-mapped and
vector fonts are supported; the size and type of text depends on the fonts that are available.
- See Also:
- _registerfonts, _unregisterfonts, _setfont,
_getfontinfo, _getgtextextent, _setgtextvector,
_getgtextvector, _outtext, _outmem, _grtext
- Example:
-
include 'graphapi.fi'
include 'graph.fi'
integer i, n
character*10 buff
call _setvideomode( _VRES16COLOR )
n = _registerfonts( '*.fon'c )
do i = 0, n - 1
write( buff, '(''n'', i2.2, a1 )' ) i, char(0)
call _setfont( buff )
call _moveto( 100, 100 )
call _outgtext( 'WATCOM Graphics'c )
pause
call _clearscreen( _GCLEARSCREEN )
enddo
call _unregisterfonts()
call _setvideomode( _DEFAULTMODE )
end
- Classification:
- PC Graphics
- Systems:
- DOS
_outmem
- Synopsis:
-
subroutine _outmem( text, length )
character*(*) text
integer*2 length
- Description:
- The _outmem routine displays the character string indicated by the argument text. The argument length
specifies the number of characters to be displayed. Unlike the _outtext routine, _outmem
will display the graphical representation of characters such as ASCII 10 and 0, instead of interpreting them as control characters.
The text is displayed using the current text color (see the _settextcolor routine), starting
at the current text position (see the _settextposition routine). The text position
is updated to follow the end of the displayed text.
The graphics library can display text in three different ways.
- The _outtext and _outmem routines can be used in any video mode.
However, this variety of text can be displayed in only one size.
- The _grtext routine displays text as a sequence of line segments, and can be drawn in different
sizes, with different orientations and alignments.
- The _outgtext routine displays text in the currently selected font. Both bit-mapped and
vector fonts are supported; the size and type of text depends on the fonts that are available.
- See Also:
- _settextcolor, _settextposition, _settextwindow,
_grtext, _outtext, _outgtext
- Example:
-
include 'graphapi.fi'
include 'graph.fi'
integer i
character*20 buf
call _clearscreen( _GCLEARSCREEN )
do i = 0, 255
call _settextposition( 1 + mod( i, 16 ),
+
1 + 5 * ( i / 16 ) )
buf( 1:1 ) = char( i )
call _outmem( buf, 1 )
enddo
pause
end
- Classification:
- PC Graphics
- Systems:
- DOS
_outtext
- Synopsis:
-
subroutine _outtext( text )
character*(*) text
- Description:
- The _outtext routine displays the character string indicated by the argument text. The string must be
terminated by a null character (char(0)). When a line-feed character (char(10)) is encountered in the string, the characters
following will be displayed on the next row of the screen.
The text is displayed using the current text color (see the _settextcolor routine), starting
at the current text position (see the _settextposition routine). The text position
is updated to follow the end of the displayed text.
The graphics library can display text in three different ways.
- The _outtext and _outmem routines can be used in any video mode.
However, this variety of text can be displayed in only one size.
- The _grtext routine displays text as a sequence of line segments, and can be drawn in different
sizes, with different orientations and alignments.
- The _outgtext routine displays text in the currently selected font. Both bit-mapped and
vector fonts are supported; the size and type of text depends on the fonts that are available.
- See Also:
- _settextcolor, _settextposition, _settextwindow,
_grtext, _outmem, _outgtext
- Example:
-
include 'graphapi.fi'
include 'graph.fi'
call _setvideomode( _TEXTC80 )
call _settextposition( 10, 30 )
call _outtext( 'WATCOM Graphics'c )
pause
call _setvideomode( _DEFAULTMODE )
end
- Classification:
- PC Graphics
- Systems:
- DOS
_pg_analyzechart, _pg_analyzechartms
- Synopsis:
-
integer*2 function _pg_analyzechart( env, cat, values, n )
record /chartenv/ env
integer*4 cat(*)
real values(*)
integer*2 n
integer*2 function _pg_analyzechartms( env, cat, values,
nseries,
n,
dim, labels
)
record /chartenv/ env
integer*4 cat(*)
real values(*)
integer*2 nseries, n, dim
integer*4 labels(*)
- Description:
- The _pg_analyzechart routines analyze either a single-series or a multi-series bar, column or line chart. These
routines calculate default values for chart elements without actually displaying the chart.
The _pg_analyzechart routine analyzes a single-series bar, column or line chart. The chart environment
structure env is filled with default values based on the type of chart and the values of the cat and values
arguments. The arguments are the same as for the _pg_chart routine.
The _pg_analyzechartms routine analyzes a multi-series bar, column or line chart. The chart environment
structure env is filled with default values based on the type of chart and the values of the cat, values
and labels arguments. The arguments are the same as for the _pg_chartms routine.
- Returns:
- The _pg_analyzechart routines return zero if successful; otherwise, a non-zero value is returned.
- See Also:
- _pg_defaultchart, _pg_initchart, _pg_chart,
_pg_chartpie, _pg_chartscatter, _pg_analyzepie,
_pg_analyzescatter
- Example:
-
include 'graphapi.fi'
include 'graph.fi'
include 'pgapi.fi'
include 'pg.fi'
integer NUM_VALUES
parameter (NUM_VALUES=4)
integer*4 categories( NUM_VALUES )
real values( NUM_VALUES )
+ / 20, 45,
30, 25 /
record /chartenv/ env
categories( 1 ) = loc( 'Jan'c )
categories( 2 ) = loc( 'Feb'c )
categories( 3 ) = loc( 'Mar'c )
categories( 4 ) = loc( 'Apr'c )
call _setvideomode( _VRES16COLOR )
call _pg_initchart()
call _pg_defaultchart( env,
+
_PG_COLUMNCHART, _PG_PLAINBARS )
env.maintitle.title = 'Column Chart'c
call _pg_analyzechart( env, categories,
+
values, NUM_VALUES )
! use manual scaling
env.yaxis.autoscale = 0
env.yaxis.scalemin = 0.0
env.yaxis.scalemax = 100.0
env.yaxis.ticinterval = 25.0
call _pg_chart( env, categories,
+
values, NUM_VALUES )
pause
call _setvideomode( _DEFAULTMODE )
end
- Classification:
- PC Graphics
- Systems:
- _pg_analyzechart - DOS
_pg_analyzechartms - DOS
_pg_analyzepie
- Synopsis:
-
integer*2 function _pg_analyzepie( env, cat, values,
explode, n )
record /chartenv/ env
integer*4 cat(*)
real values(*)
integer*2 explode(*), n
- Description:
- The _pg_analyzepie routine analyzes a pie chart. This routine calculates default values for chart elements
without actually displaying the chart.
The chart environment structure env is filled with default values based on the values of the cat, values
and explode arguments. The arguments are the same as for the _pg_chartpie routine.
- Returns:
- The _pg_analyzepie routine returns zero if successful; otherwise, a non-zero value is returned.
- See Also:
- _pg_defaultchart, _pg_initchart, _pg_chart,
_pg_chartpie, _pg_chartscatter, _pg_analyzechart,
_pg_analyzescatter
- Example:
-
include 'graphapi.fi'
include 'graph.fi'
include 'pgapi.fi'
include 'pg.fi'
integer NUM_VALUES
parameter (NUM_VALUES=4)
integer*4 categories( NUM_VALUES )
real values( NUM_VALUES )
+ / 20, 45,
30, 25 /
integer*2 explode( NUM_VALUES )
+ / 1, 0, 0,
0 /
record /chartenv/ env
categories( 1 ) = loc( 'Jan'c )
categories( 2 ) = loc( 'Feb'c )
categories( 3 ) = loc( 'Mar'c )
categories( 4 ) = loc( 'Apr'c )
call _setvideomode( _VRES16COLOR )
call _pg_initchart()
call _pg_defaultchart( env,
+
_PG_PIECHART, _PG_NOPERCENT )
env.maintitle.title = 'Pie Chart'c
env.legend.place = _PG_BOTTOM
call _pg_analyzepie( env, categories,
+
values, explode, NUM_VALUES )
! make legend window same width as data window
env.legend.autosize = 0
env.legend.legendwindow.x1 = env.datawindow.x1
env.legend.legendwindow.x2 = env.datawindow.x2
call _pg_chartpie( env, categories,
+
values, explode, NUM_VALUES )
pause
call _setvideomode( _DEFAULTMODE )
end
- Classification:
- PC Graphics
- Systems:
- DOS
_pg_analyzescatter, _pg_analyzescatterms
- Synopsis:
-
integer*2 function _pg_analyzescatter( env, x, y, n )
record /chartenv/ env
real x(*), y(*)
integer*2 n
integer*2 function _pg_analyzescatterms( env, x, y,
nseries, n,
dim, labels )
record /chartenv/ env
real x(*), y(*)
integer*2 nseries, n, dim
integer*4 labels(*)
- Description:
- The _pg_analyzescatter routines analyze either a single-series or a multi-series scatter chart. These routines
calculate default values for chart elements without actually displaying the chart.
The _pg_analyzescatter routine analyzes a single-series scatter chart. The chart environment structure
env is filled with default values based on the values of the x and y arguments. The arguments are
the same as for the _pg_chartscatter routine.
The _pg_analyzescatterms routine analyzes a multi-series scatter chart. The chart environment structure
env is filled with default values based on the values of the x, y and labels arguments. The
arguments are the same as for the _pg_chartscatterms routine.
- Returns:
- The _pg_analyzescatter routines return zero if successful; otherwise, a non-zero value is returned.
- See Also:
- _pg_defaultchart, _pg_initchart, _pg_chart,
_pg_chartpie, _pg_chartscatter, _pg_analyzechart,
_pg_analyzepie
- Example:
-
include 'graphapi.fi'
include 'graph.fi'
include 'pgapi.fi'
include 'pg.fi'
integer NUM_VALUES
parameter (NUM_VALUES=4)
integer NUM_SERIES
parameter (NUM_SERIES=2)
integer*4 labels( NUM_SERIES )
real x( NUM_SERIES, NUM_VALUES )
+ / 5, 15,
30, 40, 10, 20, 30, 45 /
real y( NUM_SERIES, NUM_VALUES )
+ / 10, 15,
30, 45, 40, 30, 15, 5 /
record /chartenv/ env
labels( 1 ) = loc( 'Jan'c )
labels( 2 ) = loc( 'Feb'c )
call _setvideomode( _VRES16COLOR )
call _pg_initchart()
call _pg_defaultchart( env,
+
_PG_SCATTERCHART, _PG_POINTANDLINE )
env.maintitle.title = 'Scatter Chart'c
call _pg_analyzescatterms( env, x, y, NUM_SERIES,
+
NUM_VALUES, NUM_VALUES, labels )
! display x-axis labels with 2 decimal places
env.xaxis.autoscale = 0
env.xaxis.ticdecimals = 2
call _pg_chartscatterms( env, x, y, NUM_SERIES,
+
NUM_VALUES, NUM_VALUES, labels )
pause
call _setvideomode( _DEFAULTMODE )
end
- Classification:
- PC Graphics
- Systems:
- _pg_analyzescatter - DOS
_pg_analyzescatterms - DOS
_pg_chart, _pg_chartms
- Synopsis:
-
integer*2 function _pg_chart( env, cat, values, n )
record /chartenv/ env
integer*4 cat(*)
real values(*)
integer*2 n
integer*2 function _pg_chartms( env, cat, values, nseries,
n, dim, labels )
record /chartenv/ env
integer*4 cat(*)
real values(*)
integer*2 nseries, n, dim
integer*4 labels(*)
- Description:
- The _pg_chart routines display either a single-series or a multi-series bar, column or line chart. The type
of chart displayed and other chart options are contained in the env argument. The argument cat is an
array of addresses of strings. These strings describe the categories against which the data in the values array
is charted.
The _pg_chart routine displays a bar, column or line chart from the single series of data contained in the
values array. The argument n specifies the number of values to chart.
The _pg_chartms routine displays a multi-series bar, column or line chart. The argument nseries
specifies the number of series of data to chart. The argument values is assumed to be a two-dimensional array
defined as follows:
real values( nseries, dim )
The number of values used from each series is given by the argument n, where n is less than or equal
to dim. The argument labels is an array of addresses of strings. These strings describe each of
the series and are used in the chart legend.
- Returns:
- The _pg_chart routines return zero if successful; otherwise, a non-zero value is returned.
- See Also:
- _pg_defaultchart, _pg_initchart, _pg_chartpie,
_pg_chartscatter, _pg_analyzechart, _pg_analyzepie,
_pg_analyzescatter
- Example:
-
include 'graphapi.fi'
include 'graph.fi'
include 'pgapi.fi'
include 'pg.fi'
integer NUM_VALUES
parameter (NUM_VALUES=4)
integer*4 categories( NUM_VALUES )
real values( NUM_VALUES )
+ / 20, 45,
30, 25 /
record /chartenv/ env
categories( 1 ) = loc( 'Jan'c )
categories( 2 ) = loc( 'Feb'c )
categories( 3 ) = loc( 'Mar'c )
categories( 4 ) = loc( 'Apr'c )
call _setvideomode( _VRES16COLOR )
call _pg_initchart()
call _pg_defaultchart( env,
+
_PG_COLUMNCHART, _PG_PLAINBARS )
env.maintitle.title = 'Column Chart'c
call _pg_chart( env, categories,
+
values, NUM_VALUES )
pause
call _setvideomode( _DEFAULTMODE )
end
produces the following:
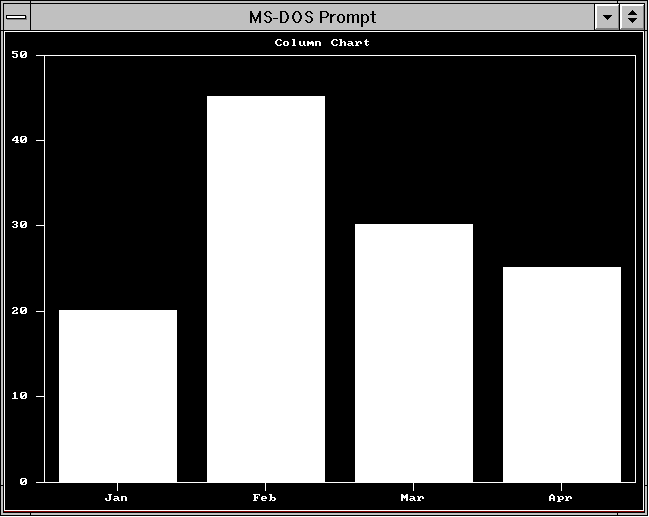
- Classification:
- PC Graphics
- Systems:
- _pg_chart - DOS
_pg_chartms - DOS
_pg_chartpie
- Synopsis:
-
integer*2 function _pg_chartpie( env, cat, values, explode, n )
record /chartenv/ env
integer*4 cat(*)
real values(*)
integer*2 explode(*), n
- Description:
- The _pg_chartpie routine displays a pie chart. The chart is displayed using the options specified in the
env argument.
The pie chart is created from the data contained in the values array. The argument n specifies the
number of values to chart.
The argument cat is an array of addresses of strings. These strings describe each of the pie slices and
are used in the chart legend. The argument explode is an array of values corresponding to each of the pie slices.
For each non-zero element in the array, the corresponding pie slice is drawn "exploded", or slightly offset
from the rest of the pie.
- Returns:
- The _pg_chartpie routine returns zero if successful; otherwise, a non-zero value is returned.
- See Also:
- _pg_defaultchart, _pg_initchart, _pg_chart,
_pg_chartscatter, _pg_analyzechart, _pg_analyzepie,
_pg_analyzescatter
- Example:
-
include 'graphapi.fi'
include 'graph.fi'
include 'pgapi.fi'
include 'pg.fi'
integer NUM_VALUES
parameter (NUM_VALUES=4)
integer*4 categories( NUM_VALUES )
real values( NUM_VALUES )
+ / 20, 45,
30, 25 /
integer*2 explode( NUM_VALUES )
+ / 1, 0, 0,
0 /
record /chartenv/ env
categories( 1 ) = loc( 'Jan'c )
categories( 2 ) = loc( 'Feb'c )
categories( 3 ) = loc( 'Mar'c )
categories( 4 ) = loc( 'Apr'c )
call _setvideomode( _VRES16COLOR )
call _pg_initchart()
call _pg_defaultchart( env,
+
_PG_PIECHART, _PG_NOPERCENT )
env.maintitle.title = 'Pie Chart'c
call _pg_chartpie( env, categories,
+
values, explode, NUM_VALUES )
pause
call _setvideomode( _DEFAULTMODE )
end
produces the following:
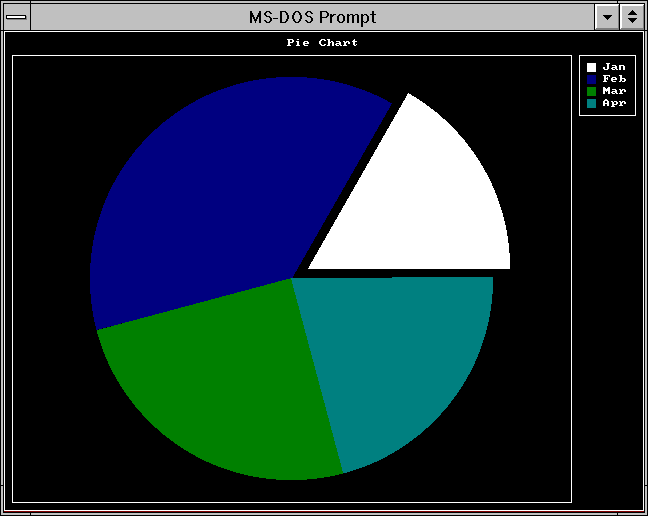
- Classification:
- PC Graphics
- Systems:
- DOS
_pg_chartscatter, _pg_chartscatterms
- Synopsis:
-
integer*2 function _pg_chartscatter( env, x, y, n )
record /chartenv/ env
float x(*), y(*)
integer*2 n
integer*2 function _pg_chartscatterms( env, x, y, nseries,
n, dim,
labels )
record /chartenv/ env
real x(*), y(*)
integer*2 nseries, n, dim
integer*4 labels(*)
- Description:
- The _pg_chartscatter routines display either a single-series or a multi-series scatter chart. The chart is
displayed using the options specified in the env argument.
The _pg_chartscatter routine displays a scatter chart from the single series of data contained in the arrays
x and y. The argument n specifies the number of values to chart.
The _pg_chartscatterms routine displays a multi-series scatter chart. The argument nseries specifies
the number of series of data to chart. The arguments x and y are assumed to be two-dimensional arrays
defined as follows:
real x( nseries, dim )
The number of values used from each series is given by the argument n, where n is less than or equal
to dim. The argument labels is an array of addresses of strings. These strings describe each of
the series and are used in the chart legend.
- Returns:
- The _pg_chartscatter routines return zero if successful; otherwise, a non-zero value is returned.
- See Also:
- _pg_defaultchart, _pg_initchart, _pg_chart,
_pg_chartpie, _pg_analyzechart, _pg_analyzepie,
_pg_analyzescatter
- Example:
-
include 'graphapi.fi'
include 'graph.fi'
include 'pgapi.fi'
include 'pg.fi'
integer NUM_VALUES
parameter (NUM_VALUES=4)
integer NUM_SERIES
parameter (NUM_SERIES=2)
integer*4 labels( NUM_SERIES )
real x( NUM_SERIES, NUM_VALUES )
+ / 5, 15,
30, 40, 10, 20, 30, 45 /
real y( NUM_SERIES, NUM_VALUES )
+ / 10, 15,
30, 45, 40, 30, 15, 5 /
record /chartenv/ env
labels( 1 ) = loc( 'Jan'c )
labels( 2 ) = loc( 'Feb'c )
call _setvideomode( _VRES16COLOR )
call _pg_initchart()
call _pg_defaultchart( env,
+
_PG_SCATTERCHART, _PG_POINTANDLINE )
env.maintitle.title = 'Scatter Chart'c
call _pg_chartscatterms( env, x, y, NUM_SERIES,
+
NUM_VALUES, NUM_VALUES, labels )
pause
call _setvideomode( _DEFAULTMODE )
end
produces the following:
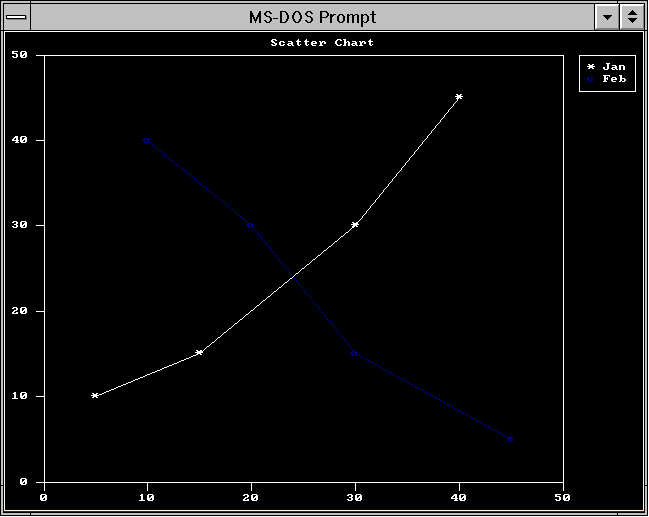
- Classification:
- PC Graphics
- Systems:
- _pg_chartscatter - DOS
_pg_chartscatterms - DOS
_pg_defaultchart
- Synopsis:
-
integer*2 function _pg_defaultchart( env, type, style )
record /chartenv/ env
integer*2 type, style
- Description:
- The _pg_defaultchart routine initializes the chart structure env to contain default values before a chart
is drawn. All values in the chart structure are initialized, including blanking of all titles. The chart type
in the structure is initialized to the value type, and the chart style is initialized to style.
The argument type can have one of the following values:
- _PG_BARCHART
- Bar chart (horizontal bars)
_PG_COLUMNCHART
- Column chart (vertical bars)
_PG_LINECHART
- Line chart
_PG_SCATTERCHART
- Scatter chart
_PG_PIECHART
- Pie chart
Each type of chart can be drawn in one of two styles. For each chart type the argument style can have one
of the following values:
Type Style 1
Style 2
Bar _PG_PLAINBARS
_PG_STACKEDBARS
Column _PG_PLAINBARS
_PG_STACKEDBARS
Line _PG_POINTANDLINE
_PG_POINTONLY
Scatter _PG_POINTANDLINE
_PG_POINTONLY
Pie _PG_PERCENT
_PG_NOPERCENT
For single-series bar and column charts, the chart style is ignored. The "plain" (clustered) and "stacked"
styles only apply when there is more than one series of data. The "percent" style for pie charts causes percentages
to be displayed beside each of the pie slices.
- Returns:
- The _pg_defaultchart routine returns zero if successful; otherwise, a non-zero value is returned.
- See Also:
- _pg_initchart, _pg_chart, _pg_chartpie,
_pg_chartscatter
- Example:
-
include 'graphapi.fi'
include 'graph.fi'
include 'pgapi.fi'
include 'pg.fi'
integer NUM_VALUES
parameter (NUM_VALUES=4)
integer*4 categories( NUM_VALUES )
real values( NUM_VALUES )
+ / 20, 45,
30, 25 /
record /chartenv/ env
categories( 1 ) = loc( 'Jan'c )
categories( 2 ) = loc( 'Feb'c )
categories( 3 ) = loc( 'Mar'c )
categories( 4 ) = loc( 'Apr'c )
call _setvideomode( _VRES16COLOR )
call _pg_initchart()
call _pg_defaultchart( env,
+
_PG_COLUMNCHART, _PG_PLAINBARS )
env.maintitle.title = 'Column Chart'c
call _pg_chart( env, categories,
+
values, NUM_VALUES )
pause
call _setvideomode( _DEFAULTMODE )
end
- Classification:
- PC Graphics
- Systems:
- DOS
_pg_getchardef
- Synopsis:
-
integer*2 function _pg_getchardef( ch, def )
integer*2 ch
integer*1 def(8)
- Description:
- The _pg_getchardef routine retrieves the current bit-map definition for the character ch. The bit-map
is placed in the array def. The current font must be an 8-by-8 bit-mapped font.
- Returns:
- The _pg_getchardef routine returns zero if successful; otherwise, a non-zero value is returned.
- See Also:
- _pg_defaultchart, _pg_initchart, _pg_chart,
_pg_chartpie, _pg_chartscatter, _pg_setchardef
- Example:
-
include 'graphapi.fi'
include 'graph.fi'
include 'pgapi.fi'
include 'pg.fi'
integer NUM_VALUES
parameter (NUM_VALUES=4)
real x( NUM_VALUES )
+ / 5, 25,
45, 65 /
real y( NUM_VALUES )
+ / 5, 45,
25, 65 /
integer*1 diamond( 8 )
+ / '10'x, '28'x,
'44'x, '82'x,
+ '44'x,
'28'x, '10'x, '00'x /
record /chartenv/ env
integer*1 old_def( 8 )
call _setvideomode( _VRES16COLOR )
call _pg_initchart()
call _pg_defaultchart( env,
+
_PG_SCATTERCHART, _PG_POINTANDLINE )
env.maintitle.title = 'Scatter Chart'c
! change asterisk character to diamond
call _pg_getchardef( ichar( '*' ), old_def )
call _pg_setchardef( ichar( '*' ), diamond )
call _pg_chartscatter( env, x, y, NUM_VALUES )
call _pg_setchardef( ichar( '*' ), old_def )
pause
call _setvideomode( _DEFAULTMODE )
end
- Classification:
- PC Graphics
- Systems:
- DOS
_pg_getpalette
- Synopsis:
-
integer*2 function _pg_getpalette( pal )
record /paletteentry/ pal(*)
- Description:
- The _pg_getpalette routine retrieves the internal palette of the presentation graphics system. The palette
controls the colors, line styles, fill patterns and plot characters used to display each series of data in a chart.
The argument pal is an array of palette structures that will contain the palette. Each element of the palette
is a structure containing the following fields:
- color
- color used to display series
style
- line style used for line and scatter charts
fill
- fill pattern used to fill interior of bar and pie sections
plotchar
- character plotted on line and scatter charts
- Returns:
- The _pg_getpalette routine returns zero if successful; otherwise, a non-zero value is returned.
- See Also:
- _pg_defaultchart, _pg_initchart, _pg_chart,
_pg_chartpie, _pg_chartscatter, _pg_setpalette,
_pg_resetpalette
- Example:
-
include 'graphapi.fi'
include 'graph.fi'
include 'pgapi.fi'
include 'pg.fi'
integer NUM_VALUES
parameter (NUM_VALUES=4)
integer*4 categories( NUM_VALUES )
real values( NUM_VALUES )
+ / 20, 45,
30, 25 /
integer*1 bricks( 8 )
+ / 'ff'x,
'80'x, '80'x, '80'x,
+
'ff'x, '08'x, '08'x, '08'x /
record /chartenv/ env
record /paletteentry/ pal( _PG_PALETTELEN )
integer i
categories( 1 ) = loc( 'Jan'c )
categories( 2 ) = loc( 'Feb'c )
categories( 3 ) = loc( 'Mar'c )
categories( 4 ) = loc( 'Apr'c )
call _setvideomode( _VRES16COLOR )
call _pg_initchart()
call _pg_defaultchart( env,
+
_PG_COLUMNCHART, _PG_PLAINBARS )
env.maintitle.title = 'Column Chart'c
! get default palette and change 1st entry
call _pg_getpalette( pal )
pal( 2 ).color = 12
do i = 1, 8
pal( 2 ).fill( i ) = bricks( i )
enddo
! use new palette
call _pg_setpalette( pal )
call _pg_chart( env, categories,
+
values, NUM_VALUES )
! reset palette to default
call _pg_resetpalette()
pause
call _setvideomode( _DEFAULTMODE )
end
- Classification:
- PC Graphics
- Systems:
- DOS
_pg_getstyleset
- Synopsis:
-
subroutine _pg_getstyleset( style )
integer*2 style(*)
- Description:
- The _pg_getstyleset routine retrieves the internal style-set of the presentation graphics system. The style-set
is a set of line styles used for drawing window borders and grid-lines. The argument style is an array that
will contain the style-set.
- See Also:
- _pg_defaultchart, _pg_initchart, _pg_chart,
_pg_chartpie, _pg_chartscatter, _pg_setstyleset,
_pg_resetstyleset
- Example:
-
include 'graphapi.fi'
include 'graph.fi'
include 'pgapi.fi'
include 'pg.fi'
integer NUM_VALUES
parameter (NUM_VALUES=4)
integer*4 categories( NUM_VALUES )
real values( NUM_VALUES )
+ / 20, 45,
30, 25 /
record /chartenv/ env
integer*2 style( _PG_PALETTELEN )
categories( 1 ) = loc( 'Jan'c )
categories( 2 ) = loc( 'Feb'c )
categories( 3 ) = loc( 'Mar'c )
categories( 4 ) = loc( 'Apr'c )
call _setvideomode( _VRES16COLOR )
call _pg_initchart()
call _pg_defaultchart( env,
+
_PG_COLUMNCHART, _PG_PLAINBARS )
env.maintitle.title = 'Column Chart'c
! turn on yaxis grid, and use style 2
env.yaxis.grid = 1
env.yaxis.gridstyle = 2
! get default style-set and change entry 2
call _pg_getstyleset( style )
style( 3 ) = '8888'x
! use new style-set
call _pg_setstyleset( style )
call _pg_chart( env, categories,
+
values, NUM_VALUES )
! reset style-set to default
call _pg_resetstyleset()
pause
call _setvideomode( _DEFAULTMODE )
end
- Classification:
- PC Graphics
- Systems:
- DOS
_pg_hlabelchart
- Synopsis:
-
integer*2 function _pg_hlabelchart( env, x, y,
color, label )
record /chartenv/ env
integer*2 x, y, color
character*(*) label
- Description:
- The _pg_hlabelchart routine displays the text string label on the chart described by the env chart
structure. The string is displayed horizontally starting at the point (x,y), relative to the upper left corner
of the chart. The color specifies the palette color used to display the string.
- Returns:
- The _pg_hlabelchart routine returns zero if successful; otherwise, a non-zero value is returned.
- See Also:
- _pg_defaultchart, _pg_initchart, _pg_chart,
_pg_chartpie, _pg_chartscatter, _pg_vlabelchart
- Example:
-
include 'graphapi.fi'
include 'graph.fi'
include 'pgapi.fi'
include 'pg.fi'
integer NUM_VALUES
parameter (NUM_VALUES=4)
integer*4 categories( NUM_VALUES )
real values( NUM_VALUES )
+ / 20, 45,
30, 25 /
record /chartenv/ env
categories( 1 ) = loc( 'Jan'c )
categories( 2 ) = loc( 'Feb'c )
categories( 3 ) = loc( 'Mar'c )
categories( 4 ) = loc( 'Apr'c )
call _setvideomode( _VRES16COLOR )
call _pg_initchart()
call _pg_defaultchart( env,
+
_PG_COLUMNCHART, _PG_PLAINBARS )
env.maintitle.title = 'Column Chart'c
call _pg_chart( env, categories,
+
values, NUM_VALUES )
call _pg_hlabelchart( env, 64, 32, 1,
+
'Horizontal label'c )
call _pg_vlabelchart( env, 48, 32, 1,
+
'Vertical label'c )
pause
call _setvideomode( _DEFAULTMODE )
end
- Classification:
- PC Graphics
- Systems:
- DOS
_pg_initchart
- Synopsis:
-
integer*2 function _pg_initchart()
- Description:
- The _pg_initchart routine initializes the presentation graphics system. This includes initializing the internal
palette and style-set used when drawing charts. This routine must be called before any of the other presentation graphics
routines.
The initialization of the presentation graphics system requires that a valid graphics mode has been selected. For
this reason the _setvideomode routine must be called before _pg_initchart is called.
If a font has been selected (with the _setfont routine), that font will be used when text is
displayed in a chart. Font selection should also be done before initializing the presentation graphics system.
- Returns:
- The _pg_initchart routine returns zero if successful; otherwise, a non-zero value is returned.
- See Also:
- _pg_defaultchart, _pg_chart, _pg_chartpie,
_pg_chartscatter, _setvideomode, _setfont,
_registerfonts
- Example:
-
include 'graphapi.fi'
include 'graph.fi'
include 'pgapi.fi'
include 'pg.fi'
integer NUM_VALUES
parameter (NUM_VALUES=4)
integer*4 categories( NUM_VALUES )
real values( NUM_VALUES )
+ / 20, 45,
30, 25 /
record /chartenv/ env
categories( 1 ) = loc( 'Jan'c )
categories( 2 ) = loc( 'Feb'c )
categories( 3 ) = loc( 'Mar'c )
categories( 4 ) = loc( 'Apr'c )
call _setvideomode( _VRES16COLOR )
call _pg_initchart()
call _pg_defaultchart( env,
+
_PG_COLUMNCHART, _PG_PLAINBARS )
env.maintitle.title = 'Column Chart'c
call _pg_chart( env, categories,
+
values, NUM_VALUES )
pause
call _setvideomode( _DEFAULTMODE )
end
- Classification:
- PC Graphics
- Systems:
- DOS
_pg_resetpalette
- Synopsis:
-
integer*2 function _pg_resetpalette()
- Description:
- The _pg_resetpalette routine resets the internal palette of the presentation graphics system to default values.
The palette controls the colors, line styles, fill patterns and plot characters used to display each series of data in a
chart. The default palette chosen is dependent on the current video mode.
- Returns:
- The _pg_resetpalette routine returns zero if successful; otherwise, a non-zero value is returned.
- See Also:
- _pg_defaultchart, _pg_initchart, _pg_chart,
_pg_chartpie, _pg_chartscatter, _pg_getpalette,
_pg_setpalette
- Example:
-
include 'graphapi.fi'
include 'graph.fi'
include 'pgapi.fi'
include 'pg.fi'
integer NUM_VALUES
parameter (NUM_VALUES=4)
integer*4 categories( NUM_VALUES )
real values( NUM_VALUES )
+ / 20, 45,
30, 25 /
integer*1 bricks( 8 )
+ / 'ff'x,
'80'x, '80'x, '80'x,
+
'ff'x, '08'x, '08'x, '08'x /
record /chartenv/ env
record /paletteentry/ pal( _PG_PALETTELEN )
integer i
categories( 1 ) = loc( 'Jan'c )
categories( 2 ) = loc( 'Feb'c )
categories( 3 ) = loc( 'Mar'c )
categories( 4 ) = loc( 'Apr'c )
call _setvideomode( _VRES16COLOR )
call _pg_initchart()
call _pg_defaultchart( env,
+
_PG_COLUMNCHART, _PG_PLAINBARS )
env.maintitle.title = 'Column Chart'c
! get default palette and change 1st entry
call _pg_getpalette( pal )
pal( 2 ).color = 12
do i = 1, 8
pal( 2 ).fill( i ) = bricks( i )
enddo
! use new palette
call _pg_setpalette( pal )
call _pg_chart( env, categories,
+
values, NUM_VALUES )
! reset palette to default
call _pg_resetpalette()
pause
call _setvideomode( _DEFAULTMODE )
end
- Classification:
- PC Graphics
- Systems:
- DOS
_pg_resetstyleset
- Synopsis:
-
subroutine _pg_resetstyleset()
- Description:
- The _pg_resetstyleset routine resets the internal style-set of the presentation graphics system to default values.
The style-set is a set of line styles used for drawing window borders and grid-lines.
- See Also:
- _pg_defaultchart, _pg_initchart, _pg_chart,
_pg_chartpie, _pg_chartscatter, _pg_getstyleset,
_pg_setstyleset
- Example:
-
include 'graphapi.fi'
include 'graph.fi'
include 'pgapi.fi'
include 'pg.fi'
integer NUM_VALUES
parameter (NUM_VALUES=4)
integer*4 categories( NUM_VALUES )
real values( NUM_VALUES )
+ / 20, 45,
30, 25 /
record /chartenv/ env
integer*2 style( _PG_PALETTELEN )
categories( 1 ) = loc( 'Jan'c )
categories( 2 ) = loc( 'Feb'c )
categories( 3 ) = loc( 'Mar'c )
categories( 4 ) = loc( 'Apr'c )
call _setvideomode( _VRES16COLOR )
call _pg_initchart()
call _pg_defaultchart( env,
+
_PG_COLUMNCHART, _PG_PLAINBARS )
env.maintitle.title = 'Column Chart'c
! turn on yaxis grid, and use style 2
env.yaxis.grid = 1
env.yaxis.gridstyle = 2
! get default style-set and change entry 2
call _pg_getstyleset( style )
style( 3 ) = '8888'x
! use new style-set
call _pg_setstyleset( style )
call _pg_chart( env, categories,
+
values, NUM_VALUES )
! reset style-set to default
call _pg_resetstyleset()
pause
call _setvideomode( _DEFAULTMODE )
end
- Classification:
- PC Graphics
- Systems:
- DOS
_pg_setchardef
- Synopsis:
-
integer*2 function _pg_setchardef( ch, def )
integer*2 ch
integer*1 def(8)
- Description:
- The _pg_setchardef routine sets the current bit-map definition for the character ch. The bit-map is
contained in the array def. The current font must be an 8-by-8 bit-mapped font.
- Returns:
- The _pg_setchardef routine returns zero if successful; otherwise, a non-zero value is returned.
- See Also:
- _pg_defaultchart, _pg_initchart, _pg_chart,
_pg_chartpie, _pg_chartscatter, _pg_getchardef
- Example:
-
include 'graphapi.fi'
include 'graph.fi'
include 'pgapi.fi'
include 'pg.fi'
integer NUM_VALUES
parameter (NUM_VALUES=4)
real x( NUM_VALUES )
+ / 5, 25,
45, 65 /
real y( NUM_VALUES )
+ / 5, 45,
25, 65 /
integer*1 diamond( 8 )
+ / '10'x, '28'x,
'44'x, '82'x,
+ '44'x,
'28'x, '10'x, '00'x /
record /chartenv/ env
integer*1 old_def( 8 )
call _setvideomode( _VRES16COLOR )
call _pg_initchart()
call _pg_defaultchart( env,
+
_PG_SCATTERCHART, _PG_POINTANDLINE )
env.maintitle.title = 'Scatter Chart'c
! change asterisk character to diamond
call _pg_getchardef( ichar( '*' ), old_def )
call _pg_setchardef( ichar( '*' ), diamond )
call _pg_chartscatter( env, x, y, NUM_VALUES )
call _pg_setchardef( ichar( '*' ), old_def )
pause
call _setvideomode( _DEFAULTMODE )
end
- Classification:
- PC Graphics
- Systems:
- DOS
_pg_setpalette
- Synopsis:
-
integer*2 function _pg_setpalette( pal )
record /paletteentry/ pal(*)
- Description:
- The _pg_setpalette routine sets the internal palette of the presentation graphics system. The palette controls
the colors, line styles, fill patterns and plot characters used to display each series of data in a chart.
The argument pal is an array of palette structures containing the new palette. Each element of the palette
is a structure containing the following fields:
- color
- color used to display series
style
- line style used for line and scatter charts
fill
- fill pattern used to fill interior of bar and pie sections
plotchar
- character plotted on line and scatter charts
- Returns:
- The _pg_setpalette routine returns zero if successful; otherwise, a non-zero value is returned.
- See Also:
- _pg_defaultchart, _pg_initchart, _pg_chart,
_pg_chartpie, _pg_chartscatter, _pg_getpalette,
_pg_resetpalette
- Example:
-
include 'graphapi.fi'
include 'graph.fi'
include 'pgapi.fi'
include 'pg.fi'
integer NUM_VALUES
parameter (NUM_VALUES=4)
integer*4 categories( NUM_VALUES )
real values( NUM_VALUES )
+ / 20, 45,
30, 25 /
integer*1 bricks( 8 )
+ / 'ff'x,
'80'x, '80'x, '80'x,
+
'ff'x, '08'x, '08'x, '08'x /
record /chartenv/ env
record /paletteentry/ pal( _PG_PALETTELEN )
integer i
categories( 1 ) = loc( 'Jan'c )
categories( 2 ) = loc( 'Feb'c )
categories( 3 ) = loc( 'Mar'c )
categories( 4 ) = loc( 'Apr'c )
call _setvideomode( _VRES16COLOR )
call _pg_initchart()
call _pg_defaultchart( env,
+
_PG_COLUMNCHART, _PG_PLAINBARS )
env.maintitle.title = 'Column Chart'c
! get default palette and change 1st entry
call _pg_getpalette( pal )
pal( 2 ).color = 12
do i = 1, 8
pal( 2 ).fill( i ) = bricks( i )
enddo
! use new palette
call _pg_setpalette( pal )
call _pg_chart( env, categories,
+
values, NUM_VALUES )
! reset palette to default
call _pg_resetpalette()
pause
call _setvideomode( _DEFAULTMODE )
end
- Classification:
- PC Graphics
- Systems:
- DOS
_pg_setstyleset
- Synopsis:
-
subroutine _pg_setstyleset( style )
integer*2 style(*)
- Description:
- The _pg_setstyleset routine retrieves the internal style-set of the presentation graphics system. The style-set
is a set of line styles used for drawing window borders and grid-lines. The argument style is an array containing
the new style-set.
- See Also:
- _pg_defaultchart, _pg_initchart, _pg_chart,
_pg_chartpie, _pg_chartscatter, _pg_getstyleset,
_pg_resetstyleset
- Example:
-
include 'graphapi.fi'
include 'graph.fi'
include 'pgapi.fi'
include 'pg.fi'
integer NUM_VALUES
parameter (NUM_VALUES=4)
integer*4 categories( NUM_VALUES )
real values( NUM_VALUES )
+ / 20, 45,
30, 25 /
record /chartenv/ env
integer*2 style( _PG_PALETTELEN )
categories( 1 ) = loc( 'Jan'c )
categories( 2 ) = loc( 'Feb'c )
categories( 3 ) = loc( 'Mar'c )
categories( 4 ) = loc( 'Apr'c )
call _setvideomode( _VRES16COLOR )
call _pg_initchart()
call _pg_defaultchart( env,
+
_PG_COLUMNCHART, _PG_PLAINBARS )
env.maintitle.title = 'Column Chart'c
! turn on yaxis grid, and use style 2
env.yaxis.grid = 1
env.yaxis.gridstyle = 2
! get default style-set and change entry 2
call _pg_getstyleset( style )
style( 3 ) = '8888'x
! use new style-set
call _pg_setstyleset( style )
call _pg_chart( env, categories,
+
values, NUM_VALUES )
! reset style-set to default
call _pg_resetstyleset()
pause
call _setvideomode( _DEFAULTMODE )
end
- Classification:
- PC Graphics
- Systems:
- DOS
_pg_vlabelchart
- Synopsis:
-
integer*2 function _pg_vlabelchart( env, x, y,
color, label )
record /chartenv/ env
integer*2 x, y, color
character*(*) label
- Description:
- The _pg_vlabelchart routine displays the text string label on the chart described by the env chart
structure. The string is displayed vertically starting at the point (x,y), relative to the upper left corner
of the chart. The color specifies the palette color used to display the string.
- Returns:
- The _pg_vlabelchart routine returns zero if successful; otherwise, a non-zero value is returned.
- See Also:
- _pg_defaultchart, _pg_initchart, _pg_chart,
_pg_chartpie, _pg_chartscatter, _pg_hlabelchart
- Example:
-
include 'graphapi.fi'
include 'graph.fi'
include 'pgapi.fi'
include 'pg.fi'
integer NUM_VALUES
parameter (NUM_VALUES=4)
integer*4 categories( NUM_VALUES )
real values( NUM_VALUES )
+ / 20, 45,
30, 25 /
record /chartenv/ env
categories( 1 ) = loc( 'Jan'c )
categories( 2 ) = loc( 'Feb'c )
categories( 3 ) = loc( 'Mar'c )
categories( 4 ) = loc( 'Apr'c )
call _setvideomode( _VRES16COLOR )
call _pg_initchart()
call _pg_defaultchart( env,
+
_PG_COLUMNCHART, _PG_PLAINBARS )
env.maintitle.title = 'Column Chart'c
call _pg_chart( env, categories,
+
values, NUM_VALUES )
call _pg_hlabelchart( env, 64, 32, 1,
+
'Horizontal label'c )
call _pg_vlabelchart( env, 48, 32, 1,
+
'Vertical label'c )
pause
call _setvideomode( _DEFAULTMODE )
end
- Classification:
- PC Graphics
- Systems:
- DOS
_pie, _pie_w, _pie_wxy
- Synopsis:
-
integer*2 function _pie( fill, x1, y1, x2, y2,
x3, y3, x4, y4 )
integer*2 fill
integer*2 x1, y1
integer*2 x2, y2
integer*2 x3, y3
integer*2 x4, y4
integer*2 function _pie_w( fill, x1, y1, x2, y2,
x3, y3, x4, y4 )
integer*2 fill
double precision x1, y1
double precision x2, y2
double precision x3, y3
double precision x4, y4
integer*2 function _pie_wxy( fill, p1, p2, p3, p4 )
integer*2 fill,
record /_wxycoord/ p1, p2
record /_wxycoord/ p3, p4
- Description:
- The _pie routines draw pie-shaped wedges. The _pie routine uses the view coordinate system.
The _pie_w and _pie_wxy routines use the window coordinate system.
The pie wedges are drawn by drawing an elliptical arc (in the way described for the _arc routines)
and then joining the center of the rectangle that contains the ellipse to the two endpoints of the arc.
The elliptical arc is drawn with its center at the center of the rectangle established by the points (x1,y1)
and (x2,y2). The arc is a segment of the ellipse drawn within this bounding rectangle. The arc starts
at the point on this ellipse that intersects the vector from the centre of the ellipse to the point (x3,y3).
The arc ends at the point on this ellipse that intersects the vector from the centre of the ellipse to the point (x4,y4).
The arc is drawn in a counter-clockwise direction with the current plot action using the current color and the current
line style.
The following picture illustrates the way in which the bounding rectangle and the vectors specifying the start and
end points are defined.

When the coordinates (x1,y1) and (x2,y2) establish a line or a point (this happens when one or more
of the x-coordinates or y-coordinates are equal), nothing is drawn.
The argument fill determines whether the figure is filled in or has only its outline drawn. The argument
can have one of two values:
- _GFILLINTERIOR
- fill the interior by writing pixels with the current plot action using the current color and the current fill mask
_GBORDER
- leave the interior unchanged; draw the outline of the figure with the current plot action using the current color and line
style
- Returns:
- The _pie routines return a non-zero value when the figure was successfully drawn; otherwise, zero is returned.
- See Also:
- _arc, _ellipse, _setcolor, _setfillmask,
_setlinestyle, _setplotaction
- Example:
-
include 'graphapi.fi'
include 'graph.fi'
call _setvideomode( _VRES16COLOR )
call _pie( _GBORDER, 120, 90, 520, 390,
+
140, 20, 190, 460 )
pause
call _setvideomode( _DEFAULTMODE )
end
produces the following:
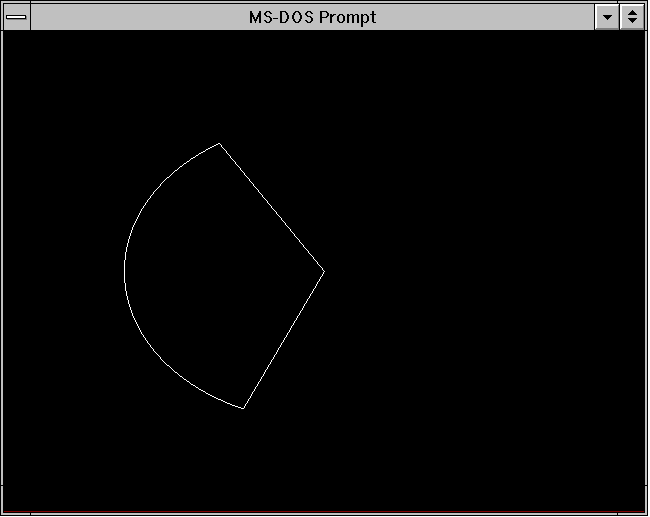
- Classification:
- PC Graphics
- Systems:
- _pie - DOS
_pie_w - DOS
_pie_wxy - DOS
_polygon, _polygon_w, _polygon_wxy
- Synopsis:
-
integer*2 function _polygon( fill, numpts, points )
integer*2 fill
integer*2 numpts
record /xycoord/ points(*)
integer*2 function _polygon_w( fill, numpts, points )
integer*2 fill
integer*2 numpts
double precision points(*)
integer*2 function _polygon_wxy( fill, numpts, points )
integer*2 fill
integer*2 numpts
record /_wxycoord/ points(*)
- Description:
- The _polygon routines draw polygons. The _polygon routine uses the view coordinate system. The
_polygon_w and _polygon_wxy routines use the window coordinate system.
The polygon is defined as containing numpts points whose coordinates are given in the array points.
The argument fill determines whether the polygon is filled in or has only its outline drawn. The argument
can have one of two values:
- _GFILLINTERIOR
- fill the interior by writing pixels with the current plot action using the current color and the current fill mask
_GBORDER
- leave the interior unchanged; draw the outline of the figure with the current plot action using the current color and line
style
- Returns:
- The _polygon routines return a non-zero value when the polygon was successfully drawn; otherwise, zero is returned.
- See Also:
- _setcolor, _setfillmask, _setlinestyle,
_setplotaction
- Example:
-
include 'graphapi.fi'
include 'graph.fi'
record /xycoord/ points(5)/
+ 319, 140, 224, 209, 261, 320,
+ 378, 320, 415, 209/
call _setvideomode( _VRES16COLOR )
call _polygon( _GBORDER, 5, points )
pause
call _setvideomode( _DEFAULTMODE )
end
produces the following:
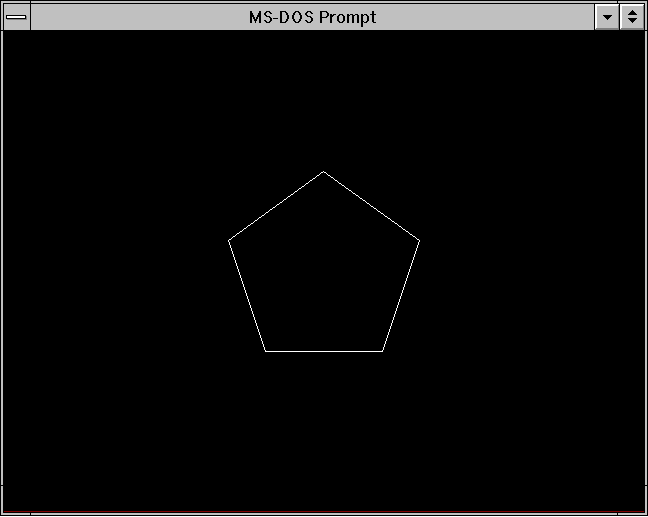
- Classification:
- PC Graphics
- Systems:
- _polygon - DOS
_polygon_w - DOS
_polygon_wxy - DOS
_putimage, _putimage_w
- Synopsis:
-
subroutine _putimage( x, y, image, mode )
integer*2 x, y
integer*1 image(*)
integer*2 mode
subroutine _putimage_w( x, y, image, mode )
double precision x, y
integer*1 image(*)
integer*2 mode
- Description:
- The _putimage routines display the screen image indicated by the argument image. The _putimage
routine uses the view coordinate system. The _putimage_w routine uses the window coordinate system.
The image is displayed upon the screen with its top left corner located at the point with coordinates (x,y).
The image was previously saved using the _getimage routines. The image is displayed
in a rectangle whose size is the size of the rectangular image saved by the _getimage routines.
The image can be displayed in a number of ways, depending upon the value of the mode argument. This argument
can have the following values:
- _GPSET
- replace the rectangle on the screen by the saved image
_GPRESET
- replace the rectangle on the screen with the pixel values of the saved image inverted; this produces a negative image
_GAND
- produce a new image on the screen by ANDing together the pixel values from the screen with those from the saved image
_GOR
- produce a new image on the screen by ORing together the pixel values from the screen with those from the saved image
_GXOR
- produce a new image on the screen by exclusive ORing together the pixel values from the screen with those from the saved image;
the original screen is restored by two successive calls to the _putimage routine with this value, providing an efficient
method to produce animated effects
- See Also:
- _getimage, _imagesize
- Example:
-
include 'graphapi.fi'
include 'graph.fi'
integer*1 image(:)
integer y, image_size, istat
call _setvideomode( _VRES16COLOR )
call _ellipse( _GFILLINTERIOR,
+
100, 100, 200, 200 )
image_size = _imagesize( 100, 100, 201, 201 )
allocate( image(image_size), stat = istat )
if( istat .eq. 0 )then
call _getimage( 100, 100, 201, 201, image )
call _putimage( 260, 200, image, _GPSET )
call _putimage( 420, 100, image, _GPSET )
do y = 100, 280, 20
call _putimage( 420, y,
image, _GXOR )
call _putimage( 420, y+20,
image, _GXOR )
enddo
deallocate( image )
endif
pause
call _setvideomode( _DEFAULTMODE )
end
- Classification:
- PC Graphics
- Systems:
- _putimage - DOS
_putimage_w - DOS
_rectangle, _rectangle_w, _rectangle_wxy
- Synopsis:
-
integer*2 function _rectangle( fill, x1, y1, x2, y2 )
integer*2 fill
integer*2 x1, y1
integer*2 x2, y2
integer*2 function _rectangle_w( fill, x1, y1, x2, y2 )
integer*2 fill
double precision x1, y1
double precision x2, y2
integer*2 function _rectangle_wxy( fill, p1, p2 )
integer*2 fill
record /_wxycoord/ p1, p2
- Description:
- The _rectangle routines draw rectangles. The _rectangle routine uses the view coordinate system.
The _rectangle_w and _rectangle_wxy routines use the window coordinate system.
The rectangle is defined with opposite corners established by the points (x1,y1) and (x2,y2).
The argument fill determines whether the rectangle is filled in or has only its outline drawn. The argument
can have one of two values:
- _GFILLINTERIOR
- fill the interior by writing pixels with the current plot action using the current color and the current fill mask
_GBORDER
- leave the interior unchanged; draw the outline of the figure with the current plot action using the current color and line
style
- Returns:
- The _rectangle routines return a non-zero value when the rectangle was successfully drawn; otherwise, zero is returned.
- See Also:
- _setcolor, _setfillmask, _setlinestyle,
_setplotaction
- Example:
-
include 'graphapi.fi'
include 'graph.fi'
call _setvideomode( _VRES16COLOR )
call _rectangle( _GBORDER, 100, 100, 540, 380 )
pause
call _setvideomode( _DEFAULTMODE )
end
produces the following:
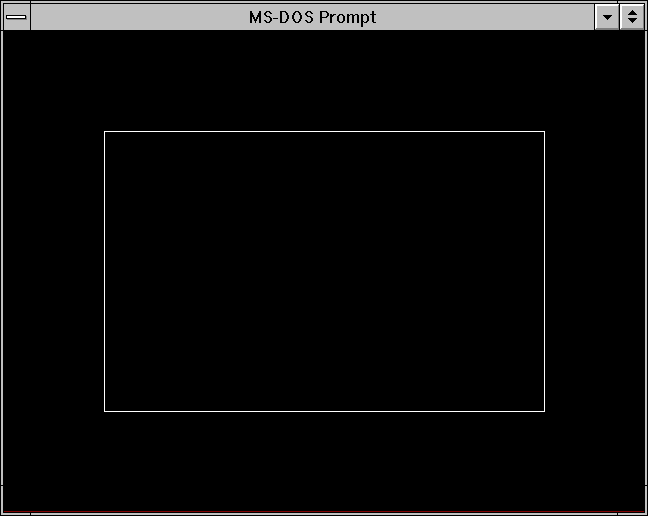
- Classification:
- PC Graphics
- Systems:
- _rectangle - DOS
_rectangle_w - DOS
_rectangle_wxy - DOS
_registerfonts
- Synopsis:
-
integer*2 function _registerfonts( path )
character*(*) path
- Description:
- The _registerfonts routine initializes the font graphics system. Fonts must be registered, and a font selected,
before text can be displayed with the _outgtext routine.
The argument path specifies the location of the font files. This argument is a file specification, and can
contain drive and directory components and may contain wildcard characters. The _registerfonts routine opens
each of the font files specified and reads the font information. Memory is allocated to store the characteristics of
the font. These font characteristics are used by the _setfont routine when selecting a font.
- Returns:
- The _registerfonts routine returns the number of fonts that were registered if the routine is successful; otherwise,
a negative number is returned.
- See Also:
- _unregisterfonts, _setfont, _getfontinfo,
_outgtext, _getgtextextent, _setgtextvector,
_getgtextvector
- Example:
-
include 'graphapi.fi'
include 'graph.fi'
integer i, n
character*10 buff
call _setvideomode( _VRES16COLOR )
n = _registerfonts( '*.fon'c )
do i = 0, n - 1
write( buff, '(''n'', i2.2, a1 )' ) i, char(0)
call _setfont( buff )
call _moveto( 100, 100 )
call _outgtext( 'WATCOM Graphics'c )
pause
call _clearscreen( _GCLEARSCREEN )
enddo
call _unregisterfonts()
call _setvideomode( _DEFAULTMODE )
end
- Classification:
- PC Graphics
- Systems:
- DOS
_remapallpalette
- Synopsis:
-
integer*2 function _remapallpalette( colors )
integer*4 colors(*)
- Description:
- The _remapallpalette routine sets (or remaps) all of the colors in the palette. The color values in the palette
are replaced by the array of color values given by the argument colors. This routine is supported in all video
modes, but only works with EGA, MCGA and VGA adapters.
The array colors must contain at least as many elements as there are supported colors. The newly mapped palette
will cause the complete screen to change color wherever there is a pixel value of a changed color in the palette.
The representation of colors depends upon the hardware being used. The number of colors in the palette can be
determined by using the _getvideoconfig routine.
- Returns:
- The _remapallpalette routine returns (-1) if the palette is remapped successfully and zero otherwise.
- See Also:
- _remappalette, _getvideoconfig
- Example:
-
include 'graphapi.fi'
include 'graph.fi'
integer colors(16)/
+ _BRIGHTWHITE, _YELLOW, _LIGHTMAGENTA,
+ _LIGHTRED, _LIGHTCYAN, _LIGHTGREEN,
+ _LIGHTBLUE, _GRAY, _WHITE, _BROWN,
+ _MAGENTA, _RED, _CYAN,
+ _GREEN, _BLUE, _BLACK/
integer x, y
call _setvideomode( _VRES16COLOR )
do y = 0, 3
do x = 0, 3
call _setcolor( x + 4 *
y )
call _rectangle( _GFILLINTERIOR,
+
x * 160, y * 120,
+
( x + 1 ) * 160, ( y + 1 ) * 120 )
enddo
enddo
pause
call _remapallpalette( colors )
pause
call _setvideomode( _DEFAULTMODE )
end
- Classification:
- PC Graphics
- Systems:
- DOS
_remappalette
- Synopsis:
-
integer*4 function _remappalette( pixval, color )
integer*2 pixval
integer*4 color
- Description:
- The _remappalette routine sets (or remaps) the palette color pixval to be the color color. This
routine is supported in all video modes, but only works with EGA, MCGA and VGA adapters.
The argument pixval is an index in the color palette of the current video mode. The argument color
specifies the actual color displayed on the screen by pixels with pixel value pixval. Color values are selected
by specifying the red, green and blue intensities that make up the color. Each intensity can be in the range from 0
to 63, resulting in 262144 possible different colors. A given color value can be conveniently specified as a value
of type integer*4. The color value is of the form '00bbggrr'x, where bb is the blue intensity,
gg is the green intensity and rr is the red intensity of the selected color. The file graph.fi
defines constants containing the color intensities of each of the 16 default colors.
The _remappalette routine takes effect immediately. All pixels on the complete screen which have a
pixel value equal to the value of pixval will now have the color indicated by the argument color.
- Returns:
- The _remappalette routine returns the previous color for the pixel value if the palette is remapped successfully;
otherwise, (-1) is returned.
- See Also:
- _remapallpalette, _setvideomode
- Example:
-
include 'graphapi.fi'
include 'graph.fi'
integer col
integer colors(16)/
+ _BLACK, _BLUE, _GREEN,
+ _CYAN, _RED, _MAGENTA,
+ _BROWN, _WHITE, _GRAY, _LIGHTBLUE,
+ _LIGHTGREEN, _LIGHTCYAN, _LIGHTRED,
+ _LIGHTMAGENTA, _YELLOW, _BRIGHTWHITE/
call _setvideomode( _VRES16COLOR )
do col = 1, 16
call _remappalette( 0, colors(col) )
pause
enddo
call _setvideomode( _DEFAULTMODE )
end
- Classification:
- PC Graphics
- Systems:
- DOS
_scrolltextwindow
- Synopsis:
-
subroutine _scrolltextwindow( rows )
integer*2 rows
- Description:
- The _scrolltextwindow routine scrolls the lines in the current text window. A text window is defined with the
_settextwindow routine. By default, the text window is the entire screen.
The argument rows specifies the number of rows to scroll. A positive value means to scroll the text window
up or towards the top of the screen. A negative value means to scroll the text window down or towards the bottom of
the screen. Specifying a number of rows greater than the height of the text window is equivalent to clearing the text
window with the _clearscreen routine.
Two constants are defined that can be used with the _scrolltextwindow routine:
- _GSCROLLUP
- the contents of the text window are scrolled up (towards the top of the screen) by one row
_GSCROLLDOWN
- the contents of the text window are scrolled down (towards the bottom of the screen) by one row
- See Also:
- _settextwindow, _clearscreen, _outtext,
_outmem, _settextposition
- Example:
-
include 'graphapi.fi'
include 'graph.fi'
integer i
character*80 buff
call _setvideomode( _TEXTC80 )
call _settextwindow( 5, 20, 20, 40 )
do i = 1, 10
write( buff, '(''Line '', i2, a1, a1 )' )
+ i, char(10), char(0)
call _outtext( buff )
enddo
pause
call _scrolltextwindow( _GSCROLLDOWN )
pause
call _scrolltextwindow( _GSCROLLUP )
pause
call _setvideomode( _DEFAULTMODE )
end
- Classification:
- PC Graphics
- Systems:
- DOS
_selectpalette
- Synopsis:
-
integer*2 function _selectpalette( palnum )
integer*2 palnum
- Description:
- The _selectpalette routine selects the palette indicated by the argument palnum from the color palettes available.
This routine is only supported by the video modes _MRES4COLOR and _MRESNOCOLOR.
Mode _MRES4COLOR supports four palettes of four colors. In each palette, color 0, the background color,
can be any of the 16 possible colors. The color values associated with the other three pixel values, (1, 2 and 3),
are determined by the selected palette.
The following table outlines the available color palettes:
Palette Pixel
Values
Number 1
2 3
0 green
red brown
1 cyan
magenta white
2 light green light red
yellow
3 light cyan light
magenta bright white
- Returns:
- The _selectpalette routine returns the number of the previously selected palette.
- See Also:
- _setvideomode, _getvideoconfig
- Example:
-
include 'graphapi.fi'
include 'graph.fi'
integer x, y, pal
call _setvideomode( _MRES4COLOR )
do y = 0, 1
do x = 0, 1
call _setcolor( x + 2 *
y )
call _rectangle( _GFILLINTERIOR,
+
x * 160, y * 100,
+
( x + 1 ) * 160, ( y + 1 ) * 100 )
enddo
enddo
do pal = 0, 3
call _selectpalette( pal )
pause
enddo
call _setvideomode( _DEFAULTMODE )
end
- Classification:
- PC Graphics
- Systems:
- DOS
_setactivepage
- Synopsis:
-
integer*2 function _setactivepage( pagenum )
integer*2 pagenum
- Description:
- The _setactivepage routine selects the page (in memory) to which graphics output is written. The page to be
selected is given by the pagenum argument.
Only some combinations of video modes and hardware allow multiple pages of graphics to exist. When multiple pages
are supported, the active page may differ from the visual page. The graphics information in the visual page determines
what is displayed upon the screen. Animation may be accomplished by alternating the visual page. A graphics page
can be constructed without affecting the screen by setting the active page to be different than the visual page.
The number of available video pages can be determined by using the _getvideoconfig
routine. The default video page is 0.
- Returns:
- The _setactivepage routine returns the number of the previous page when the active page is set successfully; otherwise,
a negative number is returned.
- See Also:
- _getactivepage, _setvisualpage, _getvisualpage,
_getvideoconfig
- Example:
-
include 'graphapi.fi'
include 'graph.fi'
integer old_apage, old_vpage
call _setvideomode( _HRES16COLOR )
old_apage = _getactivepage()
old_vpage = _getvisualpage()
! draw an ellipse on page 0
call _setactivepage( 0 )
call _setvisualpage( 0 )
call _ellipse( _GFILLINTERIOR, 100, 50,
+
540, 150 )
! draw a rectangle on page 1
call _setactivepage( 1 )
call _rectangle( _GFILLINTERIOR, 100, 50,
+
540, 150
)
pause
! display page 1
call _setvisualpage( 1 )
pause
call _setactivepage( old_apage )
call _setvisualpage( old_vpage )
call _setvideomode( _DEFAULTMODE )
end
- Classification:
- PC Graphics
- Systems:
- DOS
_setbkcolor
- Synopsis:
-
integer*4 function _setbkcolor( color )
integer*4 color
- Description:
- The _setbkcolor routine sets the current background color to be that of the color argument. In text
modes, the background color controls the area behind each individual character. In graphics modes, the background refers
to the entire screen. The default background color is 0.
When the current video mode is a graphics mode, any pixels with a zero pixel value will change to the color of the
color argument. When the current video mode is a text mode, nothing will immediately change; only subsequent output
is affected.
- Returns:
- The _setbkcolor routine returns the previous background color.
- See Also:
- _getbkcolor
- Example:
-
include 'graphapi.fi'
include 'graph.fi'
integer bk, old_bk
integer colors(16)/
+ _BLACK, _BLUE, _GREEN,
+ _CYAN, _RED, _MAGENTA,
+ _BROWN, _WHITE, _GRAY, _LIGHTBLUE,
+ _LIGHTGREEN, _LIGHTCYAN, _LIGHTRED,
+ _LIGHTMAGENTA, _YELLOW, _BRIGHTWHITE/
call _setvideomode( _VRES16COLOR )
old_bk = _getbkcolor()
do bk = 1, 16
call _setbkcolor( colors( bk ) )
pause
enddo
call _setbkcolor( old_bk )
call _setvideomode( _DEFAULTMODE )
end
- Classification:
- PC Graphics
- Systems:
- DOS
_setcharsize, _setcharsize_w
- Synopsis:
-
subroutine _setcharsize( height, width )
integer*2 height, width
subroutine _setcharsize_w( height, width )
double precision height, width
- Description:
- The _setcharsize routines set the character height and width to the values specified by the arguments height
and width. For the _setcharsize routine, the arguments height and width represent a number
of pixels. For the _setcharsize_w routine, the arguments height and width represent lengths
along the y-axis and x-axis in the window coordinate system.
These sizes are used when displaying text with the _grtext routine. The default character
sizes are dependent on the graphics mode selected, and can be determined by the _gettextsettings
routine.
- See Also:
- _grtext, _gettextsettings
- Example:
-
include 'graphapi.fi'
include 'graph.fi'
record /textsettings/ ts
call _setvideomode( _VRES16COLOR )
call _gettextsettings( ts )
call _grtext( 100, 100, 'WATCOM'c )
call _setcharsize( 2 * ts.height, 2 * ts.width )
call _grtext( 100, 300, 'Graphics'c )
call _setcharsize( ts.height, ts.width )
pause
call _setvideomode( _DEFAULTMODE )
end
produces the following:
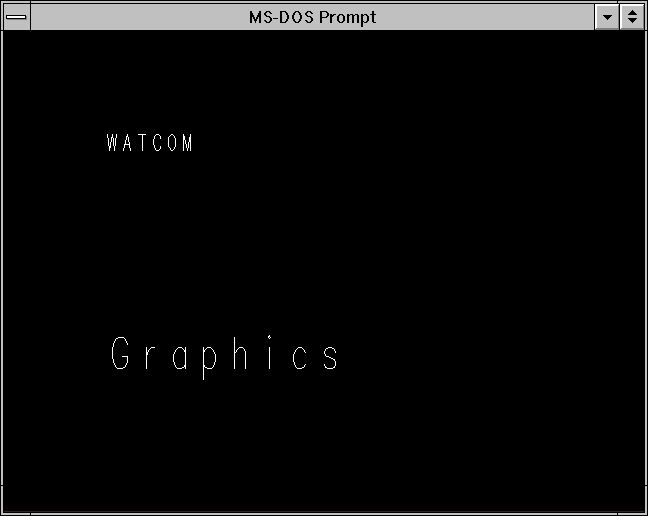
- Classification:
- PC Graphics
- Systems:
- _setcharsize - DOS
_setcharsize_w - DOS
_setcharspacing, _setcharspacing_w
- Synopsis:
-
subroutine _setcharspacing( space )
integer*2 space
subroutine _setcharspacing_w( space )
double precision space
- Description:
- The _setcharspacing routines set the current character spacing to have the value of the argument space.
For the _setcharspacing routine, space represents a number of pixels. For the _setcharspacing_w
routine, space represents a length along the x-axis in the window coordinate system.
The character spacing specifies the additional space to leave between characters when a text string is displayed with
the _grtext routine. A negative value can be specified to cause the characters to be drawn closer
together. The default value of the character spacing is 0.
- See Also:
- _grtext, _gettextsettings
- Example:
-
include 'graphapi.fi'
include 'graph.fi'
call _setvideomode( _VRES16COLOR )
call _grtext( 100, 100, 'WATCOM'c )
call _setcharspacing( 20 )
call _grtext( 100, 300, 'Graphics'c )
pause
call _setvideomode( _DEFAULTMODE )
end
produces the following:
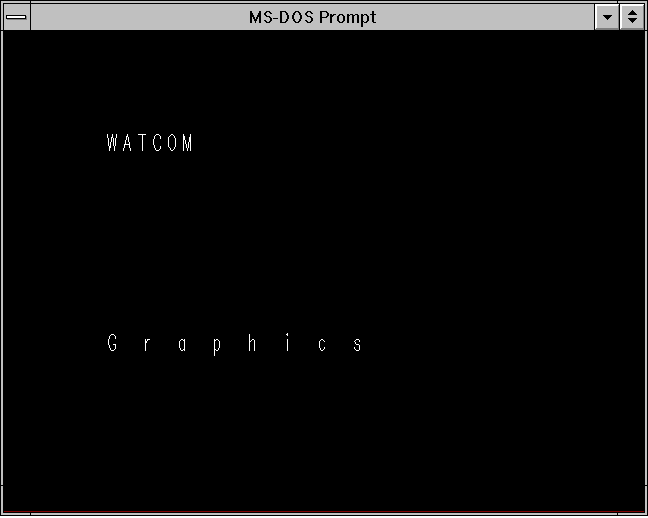
- Classification:
- PC Graphics
- Systems:
- _setcharspacing - DOS
_setcharspacing_w - DOS
_setcliprgn
- Synopsis:
-
subroutine _setcliprgn( x1, y1, x2, y2 )
integer*2 x1, y1
integer*2 x2, y2
- Description:
- The _setcliprgn routine restricts the display of graphics output to the clipping region. This region is a rectangle
whose opposite corners are established by the physical points (x1,y1) and (x2,y2).
The _setcliprgn routine does not affect text output using the _outtext and _outmem
routines. To control the location of text output, see the _settextwindow routine.
- See Also:
- _settextwindow, _setvieworg, _setviewport
- Example:
-
include 'graphapi.fi'
include 'graph.fi'
integer*2 x1, y1, x2, y2
call _setvideomode( _VRES16COLOR )
call _getcliprgn( x1, y1, x2, y2 )
call _setcliprgn( 130, 100, 510, 380 )
call _ellipse( _GBORDER, 120, 90, 520, 390 )
pause
call _setcliprgn( x1, y1, x2, y2 )
call _setvideomode( _DEFAULTMODE )
end
- Classification:
- PC Graphics
- Systems:
- DOS
_setcolor
- Synopsis:
-
integer*2 function _setcolor( pixval )
integer*2 pixval
- Description:
- The _setcolor routine sets the pixel value for the current color to be that indicated by the pixval argument.
The current color is only used by the routines that produce graphics output; text output with _outtext
uses the current text color (see the _settextcolor routine). The default color value is
one less than the maximum number of colors in the current video mode.
- Returns:
- The _setcolor routine returns the previous value of the current color.
- See Also:
- _getcolor, _settextcolor
- Example:
-
include 'graphapi.fi'
include 'graph.fi'
integer col, old_col
call _setvideomode( _VRES16COLOR )
old_col = _getcolor()
do col = 0, 15
call _setcolor( col )
call _rectangle( _GFILLINTERIOR,
+
100, 100, 540, 380 )
pause
enddo
call _setcolor( old_col )
call _setvideomode( _DEFAULTMODE )
end
- Classification:
- PC Graphics
- Systems:
- DOS
_setfillmask
- Synopsis:
-
subroutine _setfillmask( mask )
integer*1 mask(8)
- Description:
- The _setfillmask routine sets the current fill mask to the value of the argument mask.
The fill mask is an eight-byte array which is interpreted as a square pattern (8 by 8) of 64 bits. Each bit in the
mask corresponds to a pixel. When a region is filled, each point in the region is mapped onto the fill mask.
When a bit from the mask is one, the pixel value of the corresponding point is set using the current plotting action with
the current color; when the bit is zero, the pixel value of that point is not affected.
When the fill mask is not set, a fill operation will set all points in the fill region to have a pixel value of the
current color. By default, no fill mask is set.
- See Also:
- _getfillmask, _ellipse, _floodfill, _rectangle,
_polygon, _pie, _setcolor, _setplotaction
- Example:
-
include 'graphapi.fi'
include 'graph.fi'
integer*1 old_mask(8)
integer*1 new_mask(8)/
+
'81'x, '42'x, '24'x, '18'x,
+
'18'x, '24'x, '42'x, '81'x/
call _setvideomode( _VRES16COLOR )
call _getfillmask( old_mask )
call _setfillmask( new_mask )
call _rectangle( _GFILLINTERIOR,
+
100, 100, 540, 380 )
call _setfillmask( old_mask )
pause
call _setvideomode( _DEFAULTMODE )
end
produces the following:
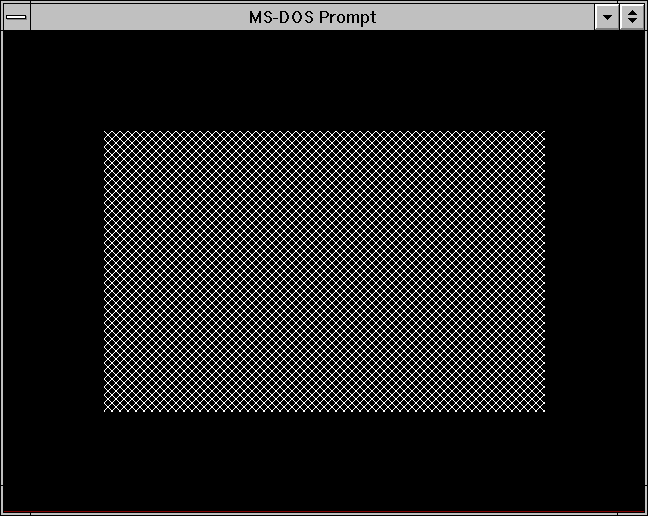
- Classification:
- PC Graphics
- Systems:
- DOS
_setfont
- Synopsis:
-
integer*2 function _setfont( opt )
character*(*) opt
- Description:
- The _setfont routine selects a font from the list of registered fonts (see the _registerfonts
routine). The font selected becomes the current font and is used whenever text is displayed with the _outgtext
routine. The routine will fail if no fonts have been registered, or if a font cannot be found that matches the given
characteristics.
The argument opt is a string of characters specifying the characteristics of the desired font. These characteristics
determine which font is selected. The options may be separated by blanks and are not case-sensitive. Any number
of options may be specified and in any order. The available options are:
- hX
- character height X (in pixels)
wX
- character width X (in pixels)
f
- choose a fixed-width font
p
- choose a proportional-width font
r
- choose a raster (bit-mapped) font
v
- choose a vector font
b
- choose the font that best matches the options
nX
- choose font number X (the number of fonts is returned by the _registerfonts routine)
t'facename'
- choose a font with specified facename
The facename option is specified as a "t" followed by a facename enclosed in single quotes. The available
facenames are:
- Courier
- fixed-width raster font with serifs
Helv
- proportional-width raster font without serifs
Tms Rmn
- proportional-width raster font with serifs
Script
- proportional-width vector font that appears similar to hand-writing
Modern
- proportional-width vector font without serifs
Roman
- proportional-width vector font with serifs
When "nX" is specified to select a particular font, the other options are ignored.
If the best fit option ("b") is specified, _setfont will always be able to select a font.
The font chosen will be the one that best matches the options specified. The following precedence is given to the options
when selecting a font:
- Pixel height (higher precedence is given to heights less than the specified height)
- Facename
- Pixel width
- Font type (fixed or proportional)
When a pixel height or width does not match exactly and a vector font has been selected, the font will be stretched appropriately
to match the given size.
- Returns:
- The _setfont routine returns zero if successful; otherwise, (-1) is returned.
- See Also:
- _registerfonts, _unregisterfonts, _getfontinfo,
_outgtext, _getgtextextent, _setgtextvector,
_getgtextvector
- Example:
-
include 'graphapi.fi'
include 'graph.fi'
integer i, n
character*10 buff
call _setvideomode( _VRES16COLOR )
n = _registerfonts( '*.fon'c )
do i = 0, n - 1
write( buff, '(''n'', i2.2, a1 )' ) i, char(0)
call _setfont( buff )
call _moveto( 100, 100 )
call _outgtext( 'WATCOM Graphics'c )
pause
call _clearscreen( _GCLEARSCREEN )
enddo
call _unregisterfonts()
call _setvideomode( _DEFAULTMODE )
end
- Classification:
- PC Graphics
- Systems:
- DOS
_setgtextvector
- Synopsis:
-
record /xycoord/ function _setgtextvector( x, y )
integer*2 x, y
- Description:
- The _setgtextvector routine sets the orientation for text output used by the _outgtext routine
to the vector specified by the arguments (x,y). Each of the arguments can have a value of -1, 0 or 1, allowing
for text to be displayed at any multiple of a 45-degree angle. The default text orientation, for normal left-to-right
text, is the vector (1,0).
- Returns:
- The _setgtextvector routine returns, as an xycoord structure, the previous value of the text orientation
vector.
- See Also:
- _registerfonts, _unregisterfonts, _setfont,
_getfontinfo, _outgtext, _getgtextextent,
_getgtextvector
- Example:
-
include 'graphapi.fi'
include 'graph.fi'
record /xycoord/ old_vec
call _setvideomode( _VRES16COLOR )
old_vec = _getgtextvector()
call _setgtextvector( 0, -1 )
call _moveto( 100, 100 )
call _outgtext( 'WATCOM Graphics'c )
call _setgtextvector( old_vec.xcoord, old_vec.ycoord )
pause
call _setvideomode( _DEFAULTMODE )
end
- Classification:
- PC Graphics
- Systems:
- DOS
_setlinestyle
- Synopsis:
-
subroutine _setlinestyle( style )
integer*2 style
- Description:
- The _setlinestyle routine sets the current line-style mask to the value of the style argument.
The line-style mask determines the style by which lines and arcs are drawn. The mask is treated as an array of 16
bits. As a line is drawn, a pixel at a time, the bits in this array are cyclically tested. When a bit in the
array is 1, the pixel value for the current point is set using the current color according to the current plotting action;
otherwise, the pixel value for the point is left unchanged. A solid line would result from a value of 'FFFF'x
and a dashed line would result from a value of 'F0F0'x.
The default line style mask is 'FFFF'x.
- See Also:
- _getlinestyle, _lineto, _rectangle, _polygon,
_setplotaction
- Example:
-
include 'graphapi.fi'
include 'graph.fi'
integer DASHED
parameter (DASHED='f0f0'x)
integer old_style
call _setvideomode( _VRES16COLOR )
old_style = _getlinestyle()
call _setlinestyle( DASHED )
call _rectangle( _GBORDER, 100, 100, 540, 380 )
call _setlinestyle( old_style )
pause
call _setvideomode( _DEFAULTMODE )
end
produces the following:
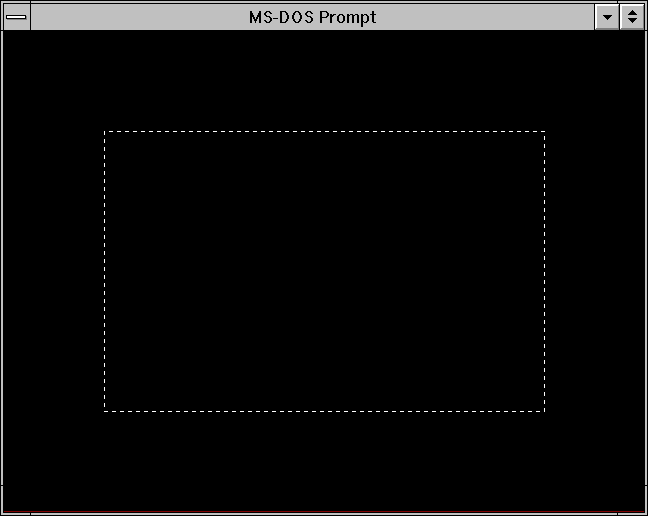
- Classification:
- PC Graphics
- Systems:
- DOS
_setpixel, _setpixel_w
- Synopsis:
-
integer*2 function _setpixel( x, y )
integer*2 x, y
integer*2 function _setpixel_w( x, y )
double precision x, y
- Description:
- The _setpixel routine sets the pixel value of the point (x,y) using the current plotting action with the
current color. The _setpixel routine uses the view coordinate system. The _setpixel_w routine
uses the window coordinate system.
A pixel value is associated with each point. The values range from 0 to the number of colors (less one) that can
be represented in the palette for the current video mode. The color displayed at the point is the color in the palette
corresponding to the pixel number. For example, a pixel value of 3 causes the fourth color in the palette to be displayed
at the point in question.
- Returns:
- The _setpixel routines return the previous value of the indicated pixel if the pixel value can be set; otherwise,
(-1) is returned.
- See Also:
- _getpixel, _setcolor, _setplotaction
- Example:
-
include 'graphapi.fi'
include 'graph.fi'
integer x, y, i
real urand
integer seed
seed = 75347
call _setvideomode( _VRES16COLOR )
call _rectangle( _GBORDER, 100, 100, 540, 380 )
do i = 0, 60000
x = 101 + mod( int( urand( seed )*32767 ),
+
439 )
y = 101 + mod( int( urand( seed )*32767 ),
+
279 )
call _setcolor( _getpixel( x, y ) + 1 )
call _setpixel( x, y )
enddo
pause
call _setvideomode( _DEFAULTMODE )
end
- Classification:
- PC Graphics
- Systems:
- _setpixel - DOS
_setpixel_w - DOS
_setplotaction
- Synopsis:
-
integer*2 function _setplotaction( action )
integer*2 action
- Description:
- The _setplotaction routine sets the current plotting action to the value of the action argument.
The drawing routines cause pixels to be set with a pixel value. By default, the value to be set is obtained by replacing
the original pixel value with the supplied pixel value. Alternatively, the replaced value may be computed as a function
of the original and the supplied pixel values.
The plotting action can have one of the following values:
- _GPSET
- replace the original screen pixel value with the supplied pixel value
_GAND
- replace the original screen pixel value with the bitwise and of the original pixel value and the supplied pixel value
_GOR
- replace the original screen pixel value with the bitwise or of the original pixel value and the supplied pixel value
_GXOR
- replace the original screen pixel value with the bitwise exclusive-or of the original pixel value and the supplied
pixel value. Performing this operation twice will restore the original screen contents, providing an efficient method
to produce animated effects.
- Returns:
- The previous value of the plotting action is returned.
- See Also:
- _getplotaction
- Example:
-
include 'graphapi.fi'
include 'graph.fi'
integer old_act
call _setvideomode( _VRES16COLOR )
old_act = _getplotaction()
call _setplotaction( _GPSET )
call _rectangle( _GFILLINTERIOR, 100, 100,
+
540, 380
)
pause
call _setplotaction( _GXOR )
call _rectangle( _GFILLINTERIOR, 100, 100,
+
540, 380
)
pause
call _setplotaction( old_act )
call _setvideomode( _DEFAULTMODE )
end
- Classification:
- PC Graphics
- Systems:
- DOS
_settextalign
- Synopsis:
-
subroutine _settextalign( horiz, vert )
integer*2 horiz, vert
- Description:
- The _settextalign routine sets the current text alignment to the values specified by the arguments horiz and
vert. When text is displayed with the _grtext routine, it is aligned (justified) horizontally
and vertically about the given point according to the current text alignment settings.
The horizontal component of the alignment can have one of the following values:
- _NORMAL
- use the default horizontal alignment for the current setting of the text path
_LEFT
- the text string is left justified at the given point
_CENTER
- the text string is centred horizontally about the given point
_RIGHT
- the text string is right justified at the given point
The vertical component of the alignment can have one of the following values:
- _NORMAL
- use the default vertical alignment for the current setting of the text path
_TOP
- the top of the text string is aligned at the given point
_CAP
- the cap line of the text string is aligned at the given point
_HALF
- the text string is centred vertically about the given point
_BASE
- the base line of the text string is aligned at the given point
_BOTTOM
- the bottom of the text string is aligned at the given point
The default is to use _LEFT alignment for the horizontal component unless the text path is _PATH_LEFT,
in which case _RIGHT alignment is used. The default value for the vertical component is _TOP unless
the text path is _PATH_UP, in which case _BOTTOM alignment is used.
- See Also:
- _grtext, _gettextsettings
- Example:
-
include 'graphapi.fi'
include 'graph.fi'
call _setvideomode( _VRES16COLOR )
call _grtext( 200, 100, 'WATCOM'c )
call _setpixel( 200, 100 )
call _settextalign( _CENTER, _HALF )
call _grtext( 200, 200, 'Graphics'c )
call _setpixel( 200, 200 )
pause
call _setvideomode( _DEFAULTMODE )
end
produces the following:
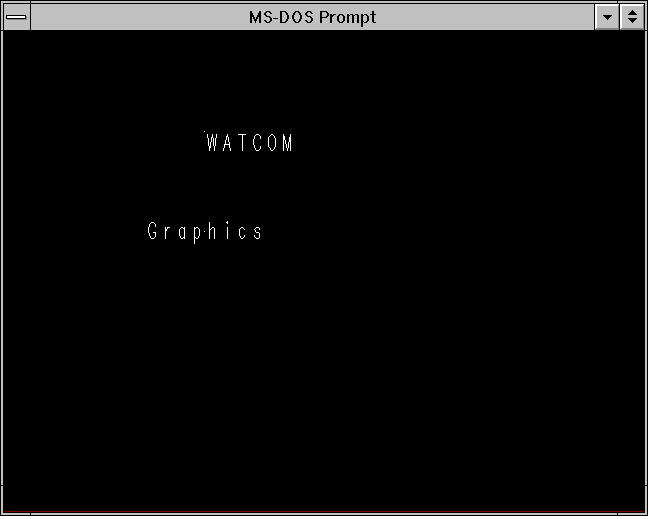
- Classification:
- PC Graphics
- Systems:
- DOS
_settextcolor
- Synopsis:
-
integer*2 function _settextcolor( pixval )
integer*2 pixval
- Description:
- The _settextcolor routine sets the current text color to be the color indicated by the pixel value of the pixval
argument. This is the color value used for displaying text with the _outtext and _outmem
routines. Use the _setcolor routine to change the color of graphics output. The default
text color value is set to 7 whenever a new video mode is selected.
The pixel value pixval is a number in the range 0-31. Colors in the range 0-15 are displayed normally.
In text modes, blinking colors are specified by adding 16 to the normal color values. The following table specifies
the default colors in color text modes.
Pixel Color Pixel
Color
value
value
0 Black
8 Gray
1 Blue
9 Light Blue
2 Green
10 Light Green
3 Cyan
11 Light Cyan
4 Red
12 Light Red
5 Magenta
13 Light Magenta
6 Brown
14 Yellow
7 White
15 Bright White
- Returns:
- The _settextcolor routine returns the pixel value of the previous text color.
- See Also:
- _gettextcolor, _outtext, _outmem, _setcolor
- Example:
-
include 'graphapi.fi'
include 'graph.fi'
integer old_col
integer old_bk
call _setvideomode( _TEXTC80 )
old_col = _gettextcolor()
old_bk = _getbkcolor()
call _settextcolor( 7 )
call _setbkcolor( _BLUE )
call _outtext( ' WATCOM '//char(10)//
+
'Graphics'c )
call _settextcolor( old_col )
call _setbkcolor( old_bk )
pause
call _setvideomode( _DEFAULTMODE )
end
- Classification:
- PC Graphics
- Systems:
- DOS
_settextcursor
- Synopsis:
-
integer*2 function _settextcursor( cursor )
integer*2 cursor
- Description:
- The _settextcursor routine sets the attribute, or shape, of the cursor in text modes. The argument cursor
specifies the new cursor shape. The cursor shape is selected by specifying the top and bottom rows in the character
matrix. The high byte of cursor specifies the top row of the cursor; the low byte specifies the bottom row.
Some typical values for cursor are:
Cursor Shape
'0607'x normal underline cursor
'0007'x full block cursor
'0407'x half-height block cursor
'2000'x no cursor
- Returns:
- The _settextcursor routine returns the previous cursor shape when the shape is set successfully; otherwise, (-1)
is returned.
- See Also:
- _gettextcursor, _displaycursor
- Example:
-
include 'graphapi.fi'
include 'graph.fi'
integer*2 old_shape
old_shape = _gettextcursor()
call _settextcursor( '0007'x )
call _outtext(
+ char(10)//'Block cursor'c )
pause
call _settextcursor( '0407'x )
call _outtext(
+ char(10)//'Half height cursor'c )
pause
call _settextcursor( '2000'x )
call _outtext(
+ char(10)//'No cursor'c )
pause
end
- Classification:
- PC Graphics
- Systems:
- DOS
_settextorient
- Synopsis:
-
subroutine _settextorient( vecx, vecy )
integer*2 vecx, vecy
- Description:
- The _settextorient routine sets the current text orientation to the vector specified by the arguments (vecx,vecy).
The text orientation specifies the direction of the base-line vector when a text string is displayed with the _grtext
routine. The default text orientation, for normal left-to-right text, is the vector (1,0).
- See Also:
- _grtext, _gettextsettings
- Example:
-
include 'graphapi.fi'
include 'graph.fi'
call _setvideomode( _VRES16COLOR )
call _grtext( 200, 100, 'WATCOM'c )
call _settextorient( 1, 1 )
call _grtext( 200, 200, 'Graphics'c )
pause
call _setvideomode( _DEFAULTMODE )
end
produces the following:
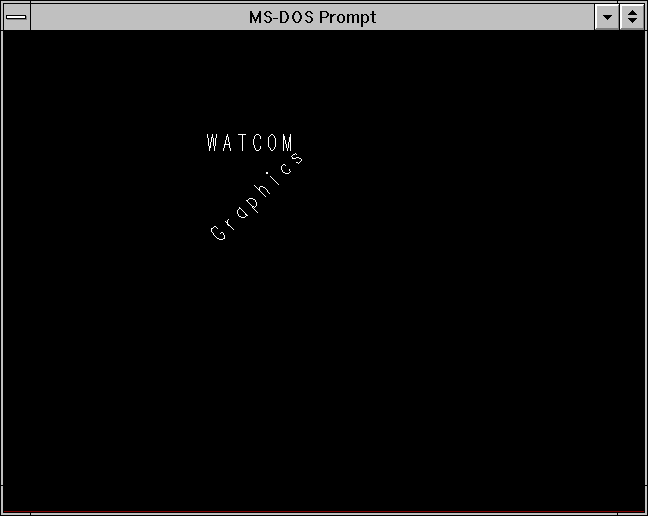
- Classification:
- PC Graphics
- Systems:
- DOS
_settextpath
- Synopsis:
-
subroutine _settextpath( path )
integer*2 path
- Description:
- The _settextpath routine sets the current text path to have the value of the path argument. The text
path specifies the writing direction of the text displayed by the _grtext routine. The argument
can have one of the following values:
- _PATH_RIGHT
- subsequent characters are drawn to the right of the previous character
_PATH_LEFT
- subsequent characters are drawn to the left of the previous character
_PATH_UP
- subsequent characters are drawn above the previous character
_PATH_DOWN
- subsequent characters are drawn below the previous character
The default value of the text path is _PATH_RIGHT.
- See Also:
- _grtext, _gettextsettings
- Example:
-
include 'graphapi.fi'
include 'graph.fi'
call _setvideomode( _VRES16COLOR )
call _grtext( 200, 100, 'WATCOM'c )
call _settextpath( _PATH_DOWN )
call _grtext( 200, 200, 'Graphics'c )
pause
call _setvideomode( _DEFAULTMODE )
end
produces the following:
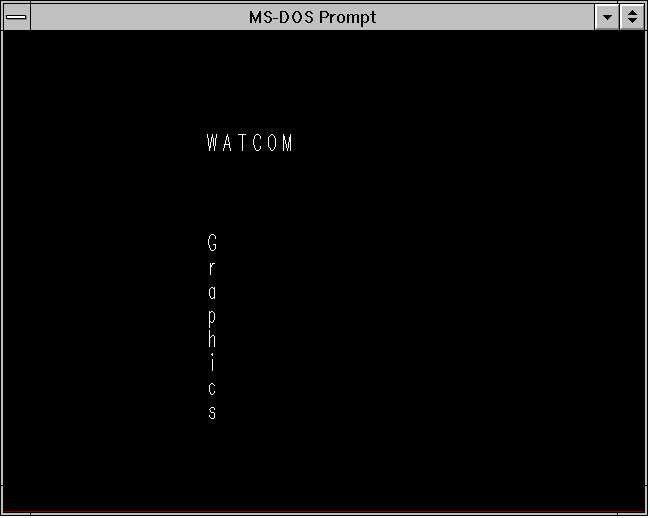
- Classification:
- PC Graphics
- Systems:
- DOS
_settextposition
- Synopsis:
-
record /rccoord/ function _settextposition( row, col )
integer*2 row, col
- Description:
- The _settextposition routine sets the current output position for text to be (row,col) where this position
is in terms of characters, not pixels.
The text position is relative to the current text window. It defaults to the top left corner of the screen,
(1,1), when a new video mode is selected, or when a new text window is set. The position is updated as text is
drawn with the _outtext and _outmem routines.
Note that the output position for graphics output differs from that for text output. The output position for
graphics output can be set by use of the _moveto routine.
- Returns:
- The _settextposition routine returns, as an rccoord structure, the previous output position for text.
- See Also:
- _gettextposition, _outtext, _outmem, _settextwindow,
_moveto
- Example:
-
include 'graphapi.fi'
include 'graph.fi'
record /rccoord/ old_pos
call _setvideomode( _TEXTC80 )
old_pos = _gettextposition()
call _settextposition( 10, 40 )
call _outtext( 'WATCOM Graphics'c )
call _settextposition( old_pos.row, old_pos.col )
pause
call _setvideomode( _DEFAULTMODE )
end
- Classification:
- PC Graphics
- Systems:
- DOS
_settextrows
- Synopsis:
-
integer*2 function _settextrows( rows )
integer*2 rows
- Description:
- The _settextrows routine selects the number of rows of text displayed on the screen. The number of rows is
specified by the argument rows. Computers equipped with EGA, MCGA and VGA adapters can support different numbers
of text rows. The number of rows that can be selected depends on the current video mode and the type of monitor attached.
If the argument rows has the value _MAXTEXTROWS, the maximum number of text rows will be selected for the
current video mode and hardware configuration. In text modes the maximum number of rows is 43 for EGA adapters, and
50 for MCGA and VGA adapters. Some graphics modes will support 43 rows for EGA adapters and 60 rows for MCGA and VGA
adapters.
- Returns:
- The _settextrows routine returns the number of screen rows when the number of rows is set successfully; otherwise,
zero is returned.
- See Also:
- _getvideoconfig, _setvideomode, _setvideomoderows
- Example:
-
include 'graphapi.fi'
include 'graph.fi'
integer valid_rows(8)/
+ 14, 25, 28, 30,
+ 34, 43, 50, 60/
integer i, j, rows
character*80 buff
do i = 0, 7
rows = valid_rows( i )
if( _settextrows( rows ) .eq. rows )then
do j = 1, rows
write( buff, '(''Line '', i2, a1 )' )
+
j, char(0)
call _settextposition( j, 1 )
call _outtext( buff )
enddo
pause
endif
enddo
call _setvideomode( _DEFAULTMODE )
end
- Classification:
- PC Graphics
- Systems:
- DOS
_settextwindow
- Synopsis:
-
subroutine _settextwindow( row1, col1, row2, col2 )
integer*2 row1, col1
integer*2 row2, col2
- Description:
- The _settextwindow routine sets the text window to be the rectangle with a top left corner at (row1,col1)
and a bottom right corner at (row2,col2). These coordinates are in terms of characters not pixels.
The initial text output position is (1,1). Subsequent text positions are reported (by the _gettextposition
routine) and set (by the _outtext, _outmem and _settextposition
routines) relative to this rectangle.
Text is displayed from the current output position for text proceeding along the current row and then downwards.
When the window is full, the lines scroll upwards one line and then text is displayed on the last line of the window.
- See Also:
- _gettextposition, _outtext, _outmem, _settextposition
- Example:
-
include 'graphapi.fi'
include 'graph.fi'
integer i
integer*2 r1, c1, r2, c2
character*80 buff
call _setvideomode( _TEXTC80 )
call _gettextwindow( r1, c1, r2, c2 )
call _settextwindow( 5, 20, 20, 40 )
do i = 1, 20
write( buff, '(''Line '', i2, a1, a1 )' )
+ i, char(10), char(0)
call _outtext( buff )
enddo
pause
call _settextwindow( r1, c1, r2, c2 )
call _setvideomode( _DEFAULTMODE )
end
- Classification:
- PC Graphics
- Systems:
- DOS
_setvideomode
- Synopsis:
-
integer*2 function _setvideomode( mode )
integer*2 mode
- Description:
- The _setvideomode routine sets the video mode according to the value of the mode argument. The value
of mode can be one of the following:
Mode Type Size
Colors Adapter
_MAXRESMODE (graphics mode with highest resolution)
_MAXCOLORMODE (graphics mode with most colors)
_DEFAULTMODE (restores screen to original mode)
_TEXTBW40 M,T 40 x 25 16
MDPA,HGC,VGA,SVGA
_TEXTC40 C,T 40 x 25
16 CGA,EGA,MCGA,VGA,SVGA
_TEXTBW80 M,T 80 x 25 16
MDPA,HGC,VGA,SVGA
_TEXTC80 C,T 80 x 25
16 CGA,EGA,MCGA,VGA,SVGA
_MRES4COLOR C,G 320 x 200 4 CGA,EGA,MCGA,VGA,SVGA
_MRESNOCOLOR C,G 320 x 200 4 CGA,EGA,MCGA,VGA,SVGA
_HRESBW C,G 640 x 200
2 CGA,EGA,MCGA,VGA,SVGA
_TEXTMONO M,T 80 x 25 16
MDPA,HGC,VGA,SVGA
_HERCMONO M,G 720 x 350 2
HGC
_MRES16COLOR C,G 320 x 200 16 EGA,VGA,SVGA
_HRES16COLOR C,G 640 x 200 16 EGA,VGA,SVGA
_ERESNOCOLOR M,G 640 x 350 4 EGA,VGA,SVGA
_ERESCOLOR C,G 640 x 350 4/16 EGA,VGA,SVGA
_VRES2COLOR C,G 640 x 480 2 MCGA,VGA,SVGA
_VRES16COLOR C,G 640 x 480 16 VGA,SVGA
_MRES256COLOR C,G 320 x 200 256 MCGA,VGA,SVGA
_URES256COLOR C,G 640 x 400 256 SVGA
_VRES256COLOR C,G 640 x 480 256 SVGA
_SVRES16COLOR C,G 800 x 600 16 SVGA
_SVRES256COLOR C,G 800 x 600 256 SVGA
_XRES16COLOR C,G 1024 x 768 16 SVGA
_XRES256COLOR C,G 1024 x 768 256 SVGA
In the preceding table, the Type column contains the following letters:
- M
- indicates monochrome; multiple colors are shades of grey
C
- indicates color
G
- indicates graphics mode; size is in pixels
T
- indicates text mode; size is in columns and rows of characters
The Adapter column contains the following codes:
- MDPA
- IBM Monochrome Display/Printer Adapter
CGA
- IBM Color Graphics Adapter
EGA
- IBM Enhanced Graphics Adapter
VGA
- IBM Video Graphics Array
MCGA
- IBM Multi-Color Graphics Array
HGC
- Hercules Graphics Adapter
SVGA
- SuperVGA adapters
The modes _MAXRESMODE and _MAXCOLORMODE will select from among the video modes supported by the current
graphics adapter the one that has the highest resolution or the greatest number of colors. The video mode will be selected
from the standard modes, not including the SuperVGA modes.
Selecting a new video mode resets the current output positions for graphics and text to be the top left corner of
the screen. The background color is reset to black and the default color value is set to be one less than the number
of colors in the selected mode.
- Returns:
- The _setvideomode routine returns the number of text rows when the new mode is successfully selected; otherwise,
zero is returned.
- See Also:
- _getvideoconfig, _settextrows, _setvideomoderows
- Example:
-
include 'graphapi.fi'
include 'graph.fi'
integer mode
record /videoconfig/ vc
character*80 buff
call _getvideoconfig( vc )
select( vc.adapter )
case( _VGA, _SVGA )
mode = _VRES16COLOR
case( _MCGA )
mode = _MRES256COLOR
case( _EGA )
if( vc.monitor .eq. _MONO )then
mode = _ERESNOCOLOR
else
mode = _ERESCOLOR
endif
case( _CGA )
mode = _MRES4COLOR
case( _HERCULES )
mode = _HERCMONO
case default
stop 'No graphics adapter'
endselect
if( _setvideomode( mode ) .ne. 0 )then
call _getvideoconfig( vc )
write( buff,
+ '( i3, '' x '',
i3, '' x '', i3, a1 )' )
+ vc.numxpixels,
vc.numypixels,
+ vc.numcolors, char(0)
call _outtext( buff )
pause
call _setvideomode( _DEFAULTMODE )
endif
end
- Classification:
- PC Graphics
- Systems:
- DOS
_setvideomoderows
- Synopsis:
-
integer*2 function _setvideomoderows( mode, rows )
integer*2 mode
integer*2 rows
- Description:
- The _setvideomoderows routine selects a video mode and the number of rows of text displayed on the screen.
The video mode is specified by the argument mode and is selected with the _setvideomode
routine. The number of rows is specified by the argument rows and is selected with the _settextrows
routine.
Computers equipped with EGA, MCGA and VGA adapters can support different numbers of text rows. The number of rows
that can be selected depends on the video mode and the type of monitor attached.
- Returns:
- The _setvideomoderows routine returns the number of screen rows when the mode and number of rows are set successfully;
otherwise, zero is returned.
- See Also:
- _getvideoconfig, _setvideomode, _settextrows
- Example:
-
include 'graphapi.fi'
include 'graph.fi'
integer rows
character*80 buff
rows = _setvideomoderows( _TEXTC80, _MAXTEXTROWS )
if( rows .ne. 0 )then
write( buff,
+ '(''Number of rows
is '', i2, a1 )' )
+ rows, char(0)
call _outtext( buff )
pause
call _setvideomode( _DEFAULTMODE )
endif
end
- Classification:
- PC Graphics
- Systems:
- DOS
_setvieworg
- Synopsis:
-
record /xycoord/ function _setvieworg( x, y )
integer*2 x, y
- Description:
- The _setvieworg routine sets the origin of the view coordinate system, (0,0), to be located at the physical
point (x,y). This causes subsequently drawn images to be translated by the amount (x,y).
- Returns:
- The _setvieworg routine returns, as an xycoord structure, the physical coordinates of the previous origin.
- See Also:
- _getviewcoord, _getphyscoord, _setcliprgn,
_setviewport
- Example:
-
include 'graphapi.fi'
include 'graph.fi'
call _setvideomode( _VRES16COLOR )
call _setvieworg( 320, 240 )
call _ellipse( _GBORDER, -200, -150, 200, 150 )
pause
call _setvideomode( _DEFAULTMODE )
end
- Classification:
- PC Graphics
- Systems:
- DOS
_setviewport
- Synopsis:
-
subroutine _setviewport( x1, y1, x2, y2 )
integer*2 x1, y1
integer*2 x2, y2
- Description:
- The _setviewport routine restricts the display of graphics output to the clipping region and then sets the origin
of the view coordinate system to be the top left corner of the region. This region is a rectangle whose opposite corners
are established by the physical points (x1,y1) and (x2,y2).
The _setviewport routine does not affect text output using the _outtext and _outmem
routines. To control the location of text output, see the _settextwindow routine.
- See Also:
- _setcliprgn, _setvieworg, _settextwindow,
_setwindow
- Example:
-
include 'graphapi.fi'
include 'graph.fi'
integer XSIZE, YSIZE
parameter (XSIZE=380)
parameter (YSIZE=280)
call _setvideomode( _VRES16COLOR )
call _setviewport( 130, 100,
+
130 + XSIZE, 100 + YSIZE )
call _ellipse( _GBORDER, 0, 0, XSIZE, YSIZE )
pause
call _setvideomode( _DEFAULTMODE )
end
- Classification:
- PC Graphics
- Systems:
- DOS
_setvisualpage
- Synopsis:
-
integer*2 function _setvisualpage( pagenum )
integer*2 pagenum
- Description:
- The _setvisualpage routine selects the page (in memory) from which graphics output is displayed. The page to
be selected is given by the pagenum argument.
Only some combinations of video modes and hardware allow multiple pages of graphics to exist. When multiple pages
are supported, the active page may differ from the visual page. The graphics information in the visual page determines
what is displayed upon the screen. Animation may be accomplished by alternating the visual page. A graphics page
can be constructed without affecting the screen by setting the active page to be different than the visual page.
The number of available video pages can be determined by using the _getvideoconfig
routine. The default video page is 0.
- Returns:
- The _setvisualpage routine returns the number of the previous page when the visual page is set successfully; otherwise,
a negative number is returned.
- See Also:
- _getvisualpage, _setactivepage, _getactivepage,
_getvideoconfig
- Example:
-
include 'graphapi.fi'
include 'graph.fi'
integer old_apage, old_vpage
call _setvideomode( _HRES16COLOR )
old_apage = _getactivepage()
old_vpage = _getvisualpage()
! draw an ellipse on page 0
call _setactivepage( 0 )
call _setvisualpage( 0 )
call _ellipse( _GFILLINTERIOR, 100, 50,
+
540, 150 )
! draw a rectangle on page 1
call _setactivepage( 1 )
call _rectangle( _GFILLINTERIOR, 100, 50,
+
540, 150
)
pause
! display page 1
call _setvisualpage( 1 )
pause
call _setactivepage( old_apage )
call _setvisualpage( old_vpage )
call _setvideomode( _DEFAULTMODE )
end
- Classification:
- PC Graphics
- Systems:
- DOS
_setwindow
- Synopsis:
-
integer*2 function _setwindow( invert, x1, y1, x2, y2 )
logical invert
double precision x1, y1
double precision x2, y2
- Description:
- The _setwindow routine defines a window for the window coordinate system. Window coordinates are specified
as a user-defined range of values. This allows for consistent pictures regardless of the video mode.
The window is defined as the region with opposite corners established by the points (x1,y1) and (x2,y2).
The argument invert specifies the direction of the y-axis. If the value is .TRUE., the y values
increase from the bottom of the screen to the top, otherwise, the y values increase as you move down the screen.
The window defined by the _setwindow routine is displayed in the current viewport. A viewport is defined
by the _setviewport routine.
By default, the window coordinate system is defined with the point (0.0,0.0) located at the lower left corner
of the screen, and the point (1.0,1.0) at the upper right corner.
- Returns:
- The _setwindow routine returns a non-zero value when the window is set successfully; otherwise, zero is returned.
- See Also:
- _setviewport
- Example:
-
include 'graphapi.fi'
include 'graph.fi'
call _setvideomode( _MAXRESMODE )
call draw_house( 'Default window'c )
call _setwindow( .TRUE., -0.5, -0.5, 1.5, 1.5 )
call draw_house( 'Larger window'c )
call _setwindow( .TRUE., 0.0, 0.0, 0.5, 1.0 )
call draw_house( 'Left side'c )
call _setvideomode( _DEFAULTMODE )
end
subroutine draw_house( msg )
include 'graph.fi'
character*80 msg
call _clearscreen( _GCLEARSCREEN )
call _outtext( msg )
call _rectangle_w( _GBORDER, 0.2, 0.1, 0.8, 0.6 )
call _moveto_w( 0.1, 0.5 )
call _lineto_w( 0.5, 0.9 )
call _lineto_w( 0.9, 0.5 )
call _arc_w( 0.4, 0.5, 0.6, 0.3,
+ 0.6,
0.4, 0.4, 0.4 )
call _rectangle_w( _GBORDER, 0.4, 0.1, 0.6, 0.4 )
pause
end
- Classification:
- PC Graphics
- Systems:
- DOS
_unregisterfonts
- Synopsis:
-
subroutine _unregisterfonts()
- Description:
- The _unregisterfonts routine frees the memory previously allocated by the _registerfonts
routine. The currently selected font is also unloaded.
Attempting to use the _setfont routine after calling _unregisterfonts will result in
an error.
- See Also:
- _registerfonts, _setfont, _getfontinfo,
_outgtext, _getgtextextent, _setgtextvector,
_getgtextvector
- Example:
-
include 'graphapi.fi'
include 'graph.fi'
integer i, n
character*10 buff
call _setvideomode( _VRES16COLOR )
n = _registerfonts( '*.fon'c )
do i = 0, n - 1
write( buff, '(''n'', i2.2, a1 )' ) i, char(0)
call _setfont( buff )
call _moveto( 100, 100 )
call _outgtext( 'WATCOM Graphics'c )
pause
call _clearscreen( _GCLEARSCREEN )
enddo
call _unregisterfonts()
call _setvideomode( _DEFAULTMODE )
end
- Classification:
- PC Graphics
- Systems:
- DOS
_wrapon
- Synopsis:
-
integer*2 function _wrapon( wrap )
integer*2 wrap
- Description:
- The _wrapon routine is used to control the display of text when the text output reaches the right side of the text
window. This is text displayed with the _outtext and _outmem routines.
The wrap argument can take one of the following values:
- _GWRAPON
- causes lines to wrap at the window border
_GWRAPOFF
- causes lines to be truncated at the window border
- Returns:
- The _wrapon routine returns the previous setting for wrapping.
- See Also:
- _outtext, _outmem, _settextwindow
- Example:
-
include 'graphapi.fi'
include 'graph.fi'
integer i
character buff*80
call _setvideomode( _TEXTC80 )
call _settextwindow( 5, 20, 20, 30 )
call _wrapon( _GWRAPOFF )
do i = 1, 3
call _settextposition( 2 * i, 1 )
write( buff,
+ '(''Very very long
line '', i2, a1)' )
+ i, char(0)
call _outtext( buff )
enddo
call _wrapon( _GWRAPON )
do i = 4, 6
call _settextposition( 2 * i, 1 )
write( buff,
+ '(''Very very long
line '', i2, a1)' )
+ i, char(0)
call _outtext( buff )
enddo
pause
call _setvideomode( _DEFAULTMODE )
end
- Classification:
- PC Graphics
- Systems:
- DOS